1. At a Glance
India’s rope and technical textile czar just quietly snapped up not one, but two Norwegian firms while you were doom-scrolling. Garware Technical Fibres is debt-light, margin-fat, ROCE-hot, and now officially international. But is this ₹930 stock worth climbing the valuation net?
2. Introduction with Hook
Imagine a spider weaving a global web—except this one exports fishing nets, aquaculture cages, and ropes, not silk. Garware is that arachnid, and it’s not just sticking to its Indian web anymore.
- ROCE: A stunning 24.7%
- Debt: Down to ₹65 Cr from ₹134 Cr—balance sheet’s been doing yoga.
Oh, and they just dropped ~₹94 crore to acquire two Norwegian firms. Because what’s global dominance without a little Viking flair?
3. Business Model (WTF Do They Even Do?)
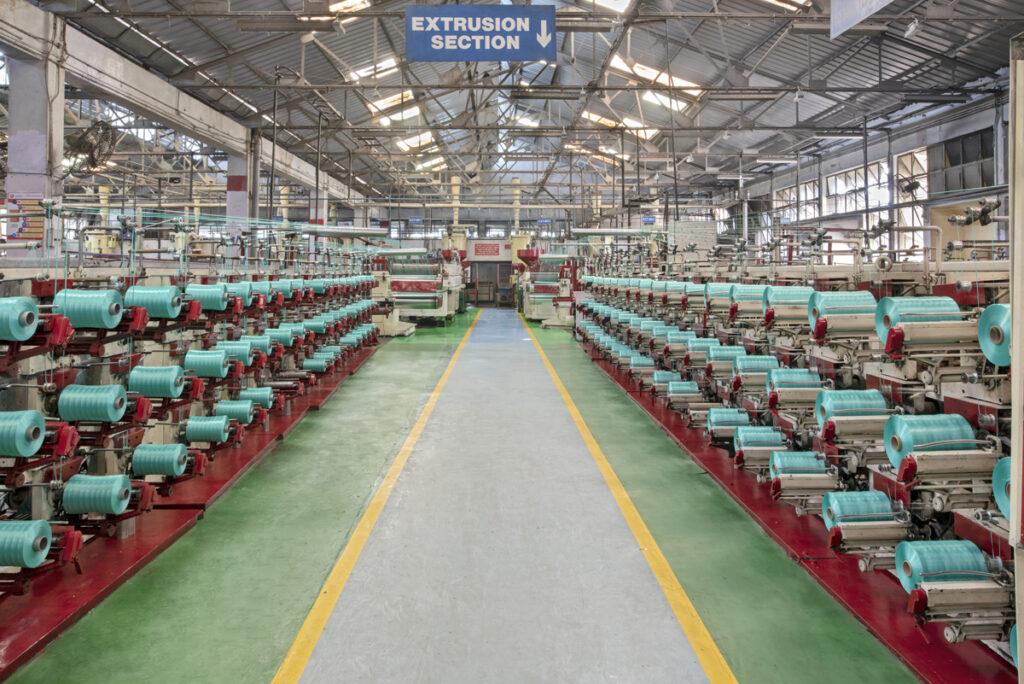
Garware is not your local baniya textile mill. This is technical textiles—high-performance ropes, fishing nets, geosynthetics, safety nets, sports nets, agricultural netting, aquaculture cages. Clients span India’s agri, marine, aquaculture, sports, and even infrastructure sectors.
Segments include:
- Cordage (Ropes & Nets): Core cash cow
- Geosynthetics & Technical Fabrics: Infrastructure focus
- Export play: Strong in Europe, Latin America, and now… Norway!
And unlike textile firms obsessed with fashion cycles, Garware makes gear that doesn’t go out of style—it just holds up bridges or traps fish better.
4. Financials Overview
Profit & Loss Snapshot (₹ Cr):
| FY | Sales | EBITDA | Net Profit | OPM % | EPS |
|---|---|---|---|---|---|
| FY21 | 1,035 | 204 | 158 | 20% | 15.36 |
| FY22 | 1,189 | 223 | 165 | 19% | 15.98 |
| FY23 | 1,306 | 230 | 172 | 18% | 16.90 |
| FY24 | 1,326 | 272 | 208 | 21% | 20.43 |
| FY25 | 1,540 | 319 | 232 | 21% | 23.33 |
Key Metrics:
- 5-Year Revenue CAGR: 10%
- 5-Year Profit CAGR: 11%
- OPM: Elevated at ~21% in FY25
- Cash from Ops FY25: ₹195 Cr
5. Valuation
Current Price: ₹931
P/E: 39.9 (Stretchy like their ropes)
Book Value: ₹125 → P/B = 7.44x (Yikes)
ROE: 18.7%
Valuation Range (Multiple Methods):
- DCF Estimate: ₹650–₹720 (Assuming modest global growth, steady margins)
- Peer Multiple (avg P/E ~20x): ₹465–₹520
- EduInvesting “Premium for Tech Textiles” Adjusted Fair Range: ₹700–₹800
Verdict: Priced for perfection. But if growth from Norway and higher-margin products kick in—it’s possible the valuation math gets rewritten.
6. What’s Cooking – News, Triggers, Drama
- Norwegian Double Dip: Two acquisitions completed in July 2025
- Capex Light, Margin Heavy: FY25 saw OPM hit 21%, with operating profit at ₹319 Cr
- FIIs + DIIs buying quietly: From 15% in FY22 to 21% now
- EPS grew 38% over 2 years
- Dividend payout still stingy at 6%—more for reinvestment?
Also, the new Norway angle could open premium EU markets, reduce seasonality in marine segments, and boost Euro-denominated exports.
7. Balance Sheet
| Item | FY25 (₹ Cr) |
|---|---|
| Equity Capital | 99 |
| Reserves | 1,142 |
| Borrowings | 65 |
| Investments | 703 |
| Fixed Assets | 277 |
| Total Assets | 1,757 |
Highlights:
- Debt down from ₹134 Cr to ₹65 Cr in two years
- Investment book growing faster than revenue—could mean strategic diversification
8. Cash Flow – Sab Number Game Hai
| FY | CFO | CFI | CFF | Net Flow |
|---|---|---|---|---|
| FY23 | 189 | -102 | -85 | +3 |
| FY24 | 219 | -73 | -39 | +108 |
| FY25 | 195 | -3 | -331 | -139 |
Takeaways:
- Massive outflow in FY25 due to Norway acquisition (~₹94 Cr GBP funded)
- Strong operating cash despite mild sales growth
- Investing activity cooled off in FY25; future capex could return
9. Ratios – Sexy or Stressy?
| Ratio | FY25 |
|---|---|
| ROCE | 25% |
| ROE | 18.7% |
| Debtor Days | 75 |
| Inventory Days | 227 |
| CCC | 81 days |
| P/E | 39.9 |
| P/B | 7.44 |
| Dividend Yield | 0.06% |
Hot or Not?
- ROCE + ROE = 🔥
- P/E is spicy but CCC under 100 = good ops mgmt
- Inventory slightly bloated = watch aquaculture seasonality
10. P&L Breakdown – Show Me the Money
| Item | FY25 (₹ Cr) |
|---|---|
| Sales | 1,540 |
| EBITDA | 319 |
| Other Income | 38 |
| Interest | 20 |
| Depreciation | 28 |
| PBT | 308 |
| Net Profit | 232 |
Clear margin expansion. Operating leverage is working. Other income remains consistent. Finance cost low due to debt reduction.
11. Peer Comparison
| Company | CMP | P/E | ROCE | Sales (Cr) | PAT (Cr) | OPM |
|---|---|---|---|---|---|---|
| KPR Mill | ₹1180 | 50.6 | 19.8% | 6,388 | 797 | 19.5% |
| Trident | ₹31 | 43.4 | 9.5% | 6,987 | 370 | 13.0% |
| Vardhman | ₹501 | 16.4 | 11.2% | 9,785 | 883 | 12.9% |
| Welspun | ₹143 | 21.7 | 14.4% | 10,545 | 639 | 12.3% |
| Garware | ₹931 | 39.9 | 24.7% | 1,540 | 232 | 21.0% |
Mic Drop: Garware is smaller in revenue but punches way above its weight on profitability and margins.
12. Miscellaneous – Shareholding, Promoters
| Category | Jun ’25 |
|---|---|
| Promoters | 53.00% |
| FIIs | 9.89% |
| DIIs | 10.97% |
| Public | 26.14% |
- FIIs/DIIs adding consistently since 2022
- No major pledges or insider drama
- Shareholder count: ~44,000+
13. EduInvesting Verdict™
Garware is like a Scandinavian furniture piece—minimalist debt, functional margins, and built to last. But unlike IKEA, it ain’t cheap.
It’s the underdog of technical textiles—high ROCE, global reach, zero drama, and expanding into cold Viking waters. But at a nearly 40x earnings multiple, the price assumes a near-flawless future. If Norway delivers growth and margins stay north of 20%—you might just be looking at India’s next silent compounder.
Fair Value Range: ₹700–₹800 (based on peer, DCF, margin forecasts)
Metadata
– Written by EduInvesting Research Team | July 19, 2025
– Tags: Technical Textiles, High ROCE Stocks, Garware Technical Fibres, Norwegian Acquisition, Debt Free Companies, Margin Leaders
