1. At a Glance
XPRO India is a polymer processing player best known for coextruded plastic films and dielectric dreams. It dominates white goods liners and now aims to conquer the global dielectric film market from a brand-new UAE base. But with a P/E of 72, are we packaging returns or recycling optimism?
2. Introduction with Hook
Picture this: a small Indian packaging company quietly exports plastic brains to the world’s smartest gadgets. Then—boom!—investors go gaga, stock price flies 10x in 3 years, and management decides to go international with a ₹290 Cr cap raise.
Welcome to XPRO India Ltd:
- P/E Ratio: 72.4x (Plastic ain’t cheap, apparently)
- Market Cap: ₹2,778 Cr
- FY25 Net Profit: ₹38 Cr
It’s packaging plastic, sure—but also hopes, hype, and HNI money via QIPs.
3. Business Model (WTF Do They Even Do?)
XPRO operates three major divisions:
- Coex Division (~68% revenue)
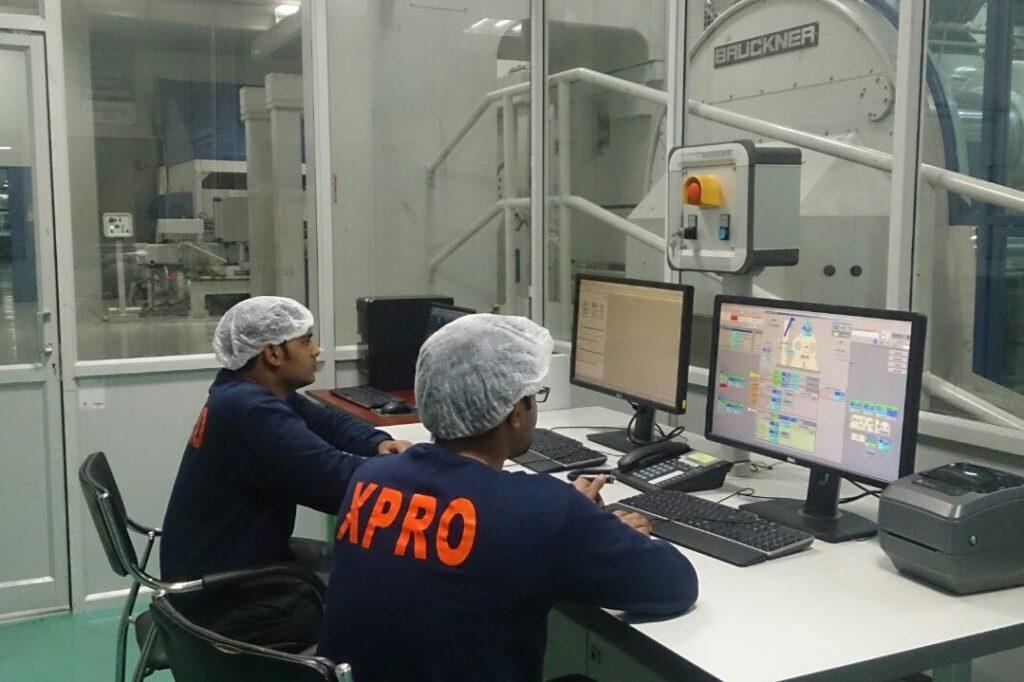
– Makes coextruded sheets, cast films, and thermoformed liners
– Major supplier to fridge OEMs (think LG, Samsung) - Dielectric Films
– Specialised polymer films used in capacitors
– Higher margin, tech-heavy product - Specialty Films
– BOPP, conductive and other purpose-specific films
It’s not just plastic. It’s engineered polymer with purpose (and a capital “P”).
4. Financials Overview
| FY | Sales (₹ Cr) | Net Profit (₹ Cr) | OPM % | EPS (₹) |
|---|---|---|---|---|
| FY21 | 370 | 8 | 11% | 4.72 |
| FY22 | 469 | 45 | 14% | 25.38 |
| FY23 | 509 | 45 | 15% | 24.91 |
| FY24 | 463 | 44 | 14% | 19.91 |
| FY25 | 533 | 38 | 10% | 17.04 |
Trend:
Revenue up. Profit down. Margins shrank faster than a polyethylene sheet under heat.
5. Valuation
Current P/E: 72.4x
Book Value: ₹274
P/B Ratio: 4.55x
Fair Value Estimate (FY26):
- EPS estimate (conservative): ₹18
- FV Range:
- 25x EPS = ₹450
- 35x EPS = ₹630
- Bubble-level 70x EPS = ₹1,260 (aka current price)
EduVerdict™: Valuation’s doing Zumba while earnings do yoga.
6. What’s Cooking – News, Triggers, Drama
- UAE Expansion: Construction started for dielectric film plant via XPRO Dielectric FZ-LLC
- Rs 290 Cr fundraise via QIP to fund expansion and pay down debt
- Warrants Issued: Preferential allotment to insiders
- Corporate Guarantees: EUR 24M backing for UAE operations
- Rating Upgrade: India Ratings gave it a pat on the back
So yes, they’re serious about going global—but the cash burn is real.
7. Balance Sheet
| Metric | FY23 | FY24 | FY25 |
|---|---|---|---|
| Equity + Reserves (₹ Cr) | 233 | 560 | 610 |
| Total Borrowings (₹ Cr) | 39 | 39 | 269 |
| Total Assets (₹ Cr) | 340 | 677 | 993 |
Key Points:
- Balance sheet ballooned 3x in 2 years
- Borrowings exploded due to UAE capex
- CWIP: ₹345 Cr in FY25 (UAE plant underway)
It’s like a plastic balloon. Big and shiny—let’s hope it doesn’t pop.
8. Cash Flow – Sab Number Game Hai
| FY | CFO (₹ Cr) | CFI (₹ Cr) | CFF (₹ Cr) | Net Flow |
|---|---|---|---|---|
| FY23 | ₹83 | -₹58 | -₹43 | -₹19 |
| FY24 | ₹44 | -₹320 | ₹278 | ₹1 |
| FY25 | ₹13 | -₹113 | ₹203 | ₹102 |
Insight:
Operating cash is cooling off like last night’s pizza. All capex funded via fresh equity and debt. Free cash flow? Negative.
9. Ratios – Sexy or Stressy?
| Metric | FY25 | Notes |
|---|---|---|
| ROCE | 7.93% | Shrinking—was 25% in FY23 |
| ROE | 6.56% | That P/E of 72 now hurts |
| OPM | 10% | Margins melted |
| Debt/Equity | 0.44x | Under control—thanks QIP |
| P/B | 4.55x | Not cheap |
Bottom Line:
This stock needs performance, not just performance plastic.
10. P&L Breakdown – Show Me the Money
| FY | Revenue | EBITDA | PAT | EPS (₹) |
|---|---|---|---|---|
| FY21 | ₹370 Cr | ₹40 Cr | ₹8 Cr | ₹4.72 |
| FY22 | ₹469 Cr | ₹64 Cr | ₹45 Cr | ₹25.38 |
| FY23 | ₹509 Cr | ₹74 Cr | ₹45 Cr | ₹24.91 |
| FY24 | ₹463 Cr | ₹66 Cr | ₹44 Cr | ₹19.91 |
| FY25 | ₹533 Cr | ₹51 Cr | ₹38 Cr | ₹17.04 |
Note: FY23 was peak. FY25? Back to Earth.
11. Peer Comparison
| Company | P/E | OPM % | ROE % | Sales (Cr) | PAT (Cr) |
|---|---|---|---|---|---|
| EPL Ltd | 20.7 | 19.8% | 16.3% | 4,213 | 362 |
| AGI Greenpac | 17.4 | 24.3% | 16.5% | 2,529 | 322 |
| Cosmo First | 22.8 | 9.9% | 9.3% | 2,895 | 130 |
| Uflex | 18.1 | 11.2% | 3.3% | 15,036 | 240 |
| XPRO India | 72.4 | 9.5% | 6.6% | 533 | 38 |
Reality Check:
Among packaging peers, XPRO has the lowest revenue, lowest margin, and highest P/E. You decide if that’s ambition or delusion.
12. Miscellaneous – Shareholding, Promoters
| Category | Jun ’22 | Mar ’25 | Trend |
|---|---|---|---|
| Promoter | 50.0% | 42.4% | -7.6% |
| FIIs | 0.5% | 14.0% | Big spike |
| DIIs | 0.09% | 3.0% | Moderate rise |
| Public | 49.4% | 40.5% | Going down |
Observation:
Promoters are cutting cake, but FIIs are eating it. And they brought spoons.
13. EduInvesting Verdict™
XPRO India is a classic case of “theme > earnings”. Dielectric films have global demand. Management is hustling hard. Expansion is real. But current valuation assumes Tesla-sized margins in a plastic wrapper.
The market priced in FY30 in FY24.
Great company-in-the-making, but this price? Your broker’s fees might give better ROI.
Metadata
– Written by EduInvesting Research Desk | 19 July 2025
– Tags: XPRO India, Dielectric Films, Plastic Packaging, Capex Expansion, UAE Plant, QIP Story, High P/E Stocks, Midcap Manufacturing, Coextruded Films, Value Trap or Growth Gem?
