1. At a Glance
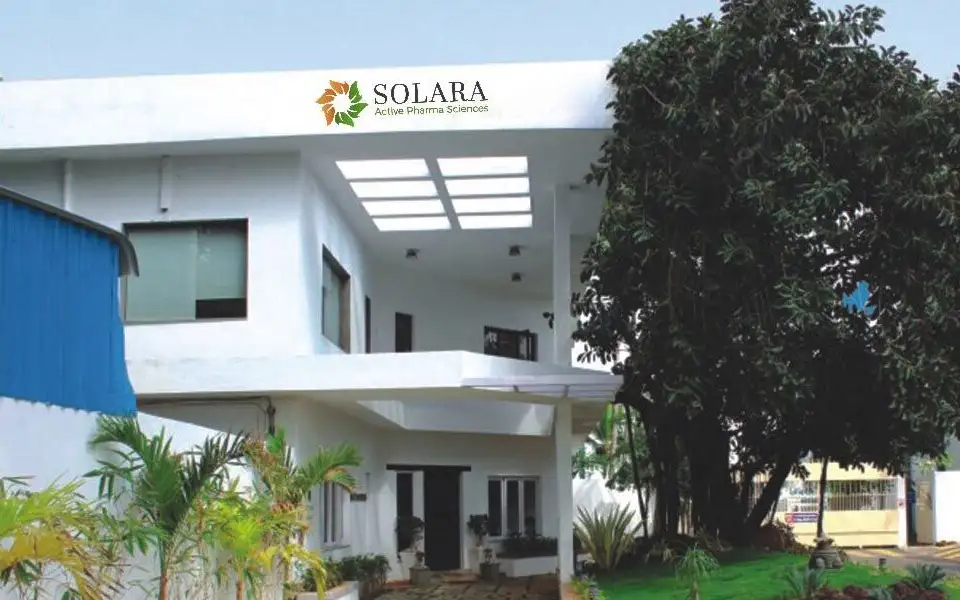
Solara Active Pharma Sciences Ltd, a pure-play API manufacturer, has gone from glory to gory and back (sort of). After a hellish FY24 with a ₹567 Cr loss, FY25 sees a faint heartbeat—₹1 Cr net profit. Is it a turnaround or just CPR before another flatline?
2. Introduction with Hook
Imagine you’re in an ambulance. Sirens blaring. Vital signs dropping. That was Solara in FY24—minus ₹567 Cr in losses, negative margins, shareholder erosion, and pledges galore.
Then in FY25, a miracle. The patient blinks. Whispers: “₹206 Cr EBITDA.”
- FY24 Net Loss: ₹567 Cr
- FY25 Net Profit: ₹1 Cr
- FY25 OPM: 16% (from -7% in FY24)
- Debt reduced by ₹216 Cr
- Rights issue: ₹449 Cr raised
Still skeptical? Yeah, us too.
3. Business Model (WTF Do They Even Do?)
Solara is all about APIs—Active Pharmaceutical Ingredients. No fancy pills, just the core molecules that make them tick.
Segments:
- 60+ commercial APIs
- 73+ countries
- Focus: Anti-infectives, anthelmintics, malaria, analgesics
- CDMO services (contract manufacturing)
Dependence Warning: Top 10 molecules = 84% of revenues. If even one slips—RIP margins.
USP? Regulatory clearances, scale in legacy APIs, and global client base.
4. Financials Overview
| FY | Revenue (₹ Cr) | EBITDA (₹ Cr) | Net Profit (₹ Cr) | OPM (%) | EPS (₹) |
|---|---|---|---|---|---|
| FY21 | 1,617 | 386 | 221 | 24% | 46.22 |
| FY22 | 1,268 | 81 | -58 | 6% | -12.11 |
| FY23 | 1,444 | 134 | -22 | 9% | -4.62 |
| FY24 | 1,289 | -95 | -567 | -7% | -118.21 |
| FY25 | 1,284 | 206 | 1 | 16% | 0.15 |
Verdict: From alpha to ICU to breathing again. FY25 was a steroid-pumped revival—but sustainable?
5. Valuation
At CMP ₹679, let’s value this phoenix:
P/E? Pointless. EPS is ₹0.15. P/E is 5,520. RIP logic.
EV/EBITDA Basis:
- FY25 EBITDA = ₹206 Cr
- EV = ₹3,700 Cr approx
- EV/EBITDA = ~18x
- Fair EV/EBITDA range: 10x–13x → Implied FV = ₹375 – ₹490
EduInvesting Fair Value Range: ₹375 – ₹500
CMP ₹679 = Hope premium.
6. What’s Cooking – News, Triggers, Drama
- Rights Issue: ₹449.95 Cr raised in Jun 2024
- USFDA Clean Chits: Puducherry & Visakhapatnam plants passed with zero observations
- Closure of Brazil Sub: Cut loss, refocus on core
- New ESOP Plan: Bet on turnaround? Or retention bribe?
Triggers to Watch:
- New product launches
- CDMO contract wins
- Margin consistency in next 2 quarters
7. Balance Sheet
| Metric | FY23 | FY24 | FY25 |
|---|---|---|---|
| Equity Capital | ₹36 Cr | ₹36 Cr | ₹40 Cr |
| Reserves | ₹1,464 Cr | ₹898 Cr | ₹1,054 Cr |
| Borrowings | ₹1,013 Cr | ₹1,012 Cr | ₹796 Cr |
| Total Liabilities | ₹2,899 Cr | ₹2,351 Cr | ₹2,232 Cr |
Notes:
- Net worth partially restored via rights issue
- Debt reduced by ₹216 Cr
- Still a long way to financial flexibility
8. Cash Flow – Sab Number Game Hai
| ₹ Cr | FY23 | FY24 | FY25 |
|---|---|---|---|
| CFO | ₹156 | ₹109 | ₹213 |
| CFI | -₹81 | -₹4 | -₹37 |
| CFF | -₹113 | -₹106 | -₹180 |
| Net Cash Flow | -₹38 | -₹0 | -₹4 |
Takeaway:
Positive operating cash, but heavy repayments = tight ropewalk. Rights issue plugged the hole for now.
9. Ratios – Sexy or Stressy?
| Metric | FY23 | FY24 | FY25 |
|---|---|---|---|
| ROCE | 2% | -9% | 6% |
| ROE | -4.6% | -118% | 0.05% |
| Debtor Days | 136 | 99 | 93 |
| Inventory Days | 258 | 163 | 185 |
| CCC | 252 | 120 | 133 |
Verdict:
ROCE limps back to life, but ROE is basically on life support. WC days better, but CCC still a drag.
10. P&L Breakdown – Show Me the Money
| ₹ Cr | FY23 | FY24 | FY25 |
|---|---|---|---|
| Revenue | ₹1,444 | ₹1,289 | ₹1,284 |
| EBITDA | ₹134 | -₹95 | ₹206 |
| PAT | -₹22 | -₹567 | ₹1 |
| EPS (₹) | -4.62 | -118.21 | 0.15 |
FY25 is barely profitable. Can’t call it a “turnaround” unless FY26 builds on this without accounting wizardry.
11. Peer Comparison
| Company | CMP (₹) | ROCE (%) | OPM (%) | Mkt Cap (Cr) |
|---|---|---|---|---|
| Sun Pharma | ₹1,694 | 20.2 | 28.8 | ₹4.06L Cr |
| Divi’s Lab | ₹6,732 | 20.4 | 31.8 | ₹1.78L Cr |
| Solara | ₹679 | 6.0 | 16.6 | ₹2,981 Cr |
Comment: Solara’s past sins keep it out of pharma elite. High-risk, high-reward bet… if it doesn’t relapse.
12. Miscellaneous – Shareholding, Promoters
| Holder Type | Mar 2025 |
|---|---|
| Promoters | 37.94% (34.6% pledged) |
| FIIs | 14.63% |
| DIIs | 2.61% |
| Public | 44.82% |
Red Flags:
- 34.6% of promoter shares pledged
- Public holding up = Retail optimism or bagholding?
Shareholder count: ~76,000
13. EduInvesting Verdict™
Solara Active Pharma is the pharma version of a Salman Khan film—chaotic, flawed, but occasionally delivers box office surprises.
- FY25 saw a dramatic EBITDA recovery
- PAT is flat, EPS is LOL
- Massive turnaround depends on consistent execution
Watchlist case, not a wallet case. If Q1–Q2 FY26 sustains ₹200+ Cr EBITDA annually and debt reduces further, re-rating could be real.
Until then… it’s “Solara Active,” not “Solara Attractive.”
Metadata
– Written by EduInvesting Research | 18 July 2025
– Tags: Solara Pharma, API Stocks, Turnaround, Rights Issue, Debt-Heavy, Pharma Special Situation, USFDA Approvals, EPS Revival


