1. At a Glance
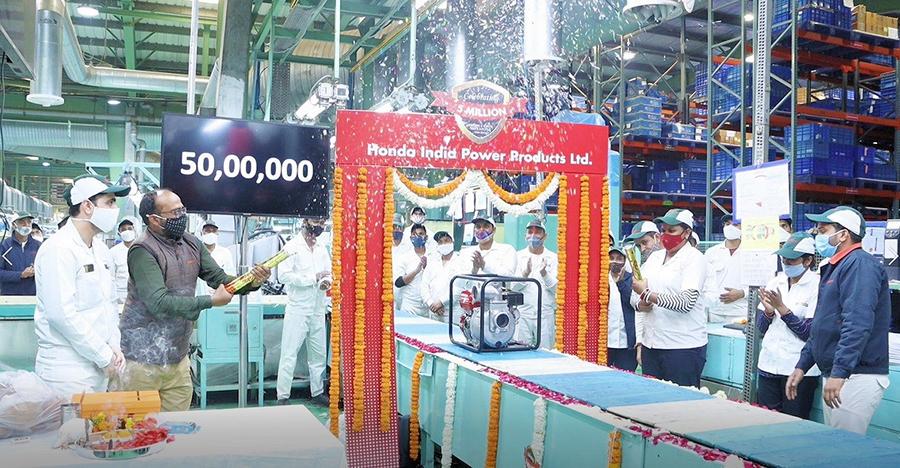
India’s OG in portable generators and pumps, Honda India Power Products (HIPPL) is a debt-free dividend-paying subsidiary of the Japanese powerhouse. But with sales declining and EPS slipping like a misfiring spark plug, is this engine sputtering or ready to roar?
2. Introduction with Hook
You know those portable generators that show up in Bollywood flood scenes and election rallies? That’s Honda India’s bread and butter.
Except lately, it’s not even toasting the bread.
- Sales down from ₹1,246 Cr (FY23) to ₹794 Cr (FY25).
- TTM EPS down 13% YoY.
- Stock is down 27% in 1 year.
Still, it sits on ₹853 Cr in reserves, zero debt, and pays a 40% dividend payout.
So is Honda India Power Products a sleeping tiger or just a well-packaged lawnmower?
3. Business Model (WTF Do They Even Do?)
HIPPL builds and sells:
- Portable Generators
- Water Pumps
- Brush Cutters & Tillers
- General Purpose Engines (GPEs)
- Lawn Mowers (cue Bollywood mansions)
It distributes via 600+ dealers across India and exports to over 35 countries.
Notable Segments:
- Agricultural usage: Pumps, tillers, etc.
- Industrial use: Backup gensets
- Government/PSU sales (seasonal)
Despite the cool product range, there’s one problem: No real product innovation in years. Just more of the same, in red plastic.
4. Financials Overview
| FY | Revenue (₹ Cr) | EBITDA (₹ Cr) | PAT (₹ Cr) | EPS (₹) | OPM % |
|---|---|---|---|---|---|
| FY22 | ₹1,156 | ₹103 | ₹75 | ₹73.5 | 9% |
| FY23 | ₹1,246 | ₹135 | ₹85 | ₹83.9 | 11% |
| FY24 | ₹989 | ₹99 | ₹92 | ₹90.9 | 10% |
| FY25 | ₹794 | ₹88 | ₹80 | ₹78.8 | 11% |
Trend Check:
- Revenues falling like rainfall in a drought.
- Margins stable, thanks to cost control & other income.
5. Valuation
At ₹2,984, this stock trades at a P/E of ~38x. That’s expensive even for a fast-growing tech firm, let alone a power tools manufacturer with -12% sales CAGR.
Method 1: P/E Valuation
- EPS (TTM): ₹78.81
- Realistic P/E: 20–25x
→ Fair Value Range: ₹1,575 – ₹1,970
Method 2: BV + ROE
- Book Value: ₹851
- ROE: ~10%
→ Intrinsic Growth = 8–10% → PEG = 3.8
→ Overvalued territory confirmed.
Verdict: Premium stock pricing for performance that screams diesel leak.
6. What’s Cooking – News, Triggers, Drama
- No New Products: The last major launch? Can’t remember.
- Dividend uptrend: 40% payout in FY25 (vs 20% avg earlier).
- Clarified abnormal volumes: July 2025, said “No UPSI” (i.e., “we’re not up to anything”).
- Retail Shareholding Rising: Despite decline in sales.
Catalyst Missing: No EV pivot. No solar genset. No hybrid innovation.
7. Balance Sheet
| Year | Equity | Reserves | Debt | Total Assets |
|---|---|---|---|---|
| FY21 | ₹10 Cr | ₹595 Cr | ₹1 Cr | ₹794 Cr |
| FY23 | ₹10 Cr | ₹727 Cr | ₹1 Cr | ₹934 Cr |
| FY25 | ₹10 Cr | ₹853 Cr | ₹0 Cr | ₹1,048 Cr |
Summary:
- Absolutely zero debt
- Reserves compounding
- Cash-rich but not capex-hungry
8. Cash Flow – Sab Number Game Hai
| Year | CFO | CFI | CFF | Net CF |
|---|---|---|---|---|
| FY23 | ₹157 Cr | -₹148 Cr | -₹16 Cr | -₹7 Cr |
| FY24 | ₹106 Cr | -₹97 Cr | -₹18 Cr | -₹9 Cr |
| FY25 | ₹22 Cr | -₹70 Cr | -₹28 Cr | -₹76 Cr |
Red Alert:
- Operating cash halved in 2 years
- Capex down, but free cash flow bleeding
- Dividend looks stretched
9. Ratios – Sexy or Stressy?
| Metric | FY23 | FY24 | FY25 |
|---|---|---|---|
| ROCE | 19% | 15% | 13% |
| ROE | 10% | 9.5% | 9.54% |
| CCC (Days) | 58 | 47 | 85 |
| Debtor Days | 21 | 19 | 54 |
Yikes:
Debtors doubled. CCC time nearly doubled = Cash stress incoming.
10. P&L Breakdown – Show Me the Money
| FY | Sales | OPM % | PAT | Other Income |
|---|---|---|---|---|
| FY23 | ₹1,246 Cr | 11% | ₹85 Cr | ₹2 Cr |
| FY24 | ₹989 Cr | 10% | ₹92 Cr | ₹45 Cr |
| FY25 | ₹794 Cr | 11% | ₹80 Cr | ₹42 Cr |
Truth Bomb:
Without that ₹42 Cr “other income,” actual PAT would’ve been closer to ₹40 Cr.
11. Peer Comparison
| Company | CMP | P/E | ROCE | EPS | Sales (₹ Cr) | Div Yield |
|---|---|---|---|---|---|---|
| Kaynes Tech | ₹5,851 | 133 | 14% | ₹44 | ₹2,721 | 0.0% |
| LMW | ₹16,060 | 165 | 4.5% | ₹103 | ₹3,033 | 0.18% |
| Tega Inds. | ₹1,940 | 65 | 18% | ₹27 | ₹1,639 | 0.11% |
| HIPPL | ₹2,984 | 38 | 12.9% | ₹78.8 | ₹794 | 0.58% |
Observation:
- Good balance sheet
- But nowhere close to high-growth industrial peers
- Dividend is only face-saving feature
12. Miscellaneous – Shareholding, Promoters
| Category | Mar 2025 |
|---|---|
| Promoters (Honda Japan) | 66.67% |
| DIIs (incl. Tata, Nippon, Quant) | 18.23% |
| FIIs | 1.17% |
| Public | 13.94% |
Notes:
- Tata Small Cap Fund & Nippon hold ~13% combined.
- Shareholder count at all-time high (23.4k)
So… someone believes in the power!
13. EduInvesting Verdict™
Honda India Power Products is the grandpa of power tools in India—reliable, steady, debt-free, and polished. But it also feels… tired.
While financials are healthy, sales are falling, growth is missing, innovation is extinct, and valuation is rich.
It’s like buying a 2025 car with a 1995 engine—great brand, but someone forgot to plug in the battery.
Verdict:
A solid company… that forgot to scale.
Metadata
– Written by EduInvesting Research | 18 July 2025
– Tags: Honda India Power, Capital Goods, Genset Stocks, Dividend Stocks, Zero Debt Stocks, Tata Small Cap Fund Holdings, Industrial Products, SmallCap Compounders


