1. At a Glance
A midcap textile player with yarn in its veins and expansion in its sights, Filatex India Ltd is pushing boundaries in polyester, power, and even plastic recycling. But will this thread weave into a multi-bagger, or unravel under market pressure?
2. Introduction with Hook
Imagine if your gym T-shirt, your curtains, and your seatbelt were all secretly funded by one midcap stock. That’s Filatex India — the invisible hand behind the polyester in your daily life.
- ₹2,604 Cr market cap.
- ₹58.6 share price.
- Expansion of ₹320 Cr underway in FY25.
- Dahej plant is the mothership of yarn mayhem.
Now ask yourself — is this stock stretching like Spandex or fraying like cheap denim?
3. Business Model (WTF Do They Even Do?)
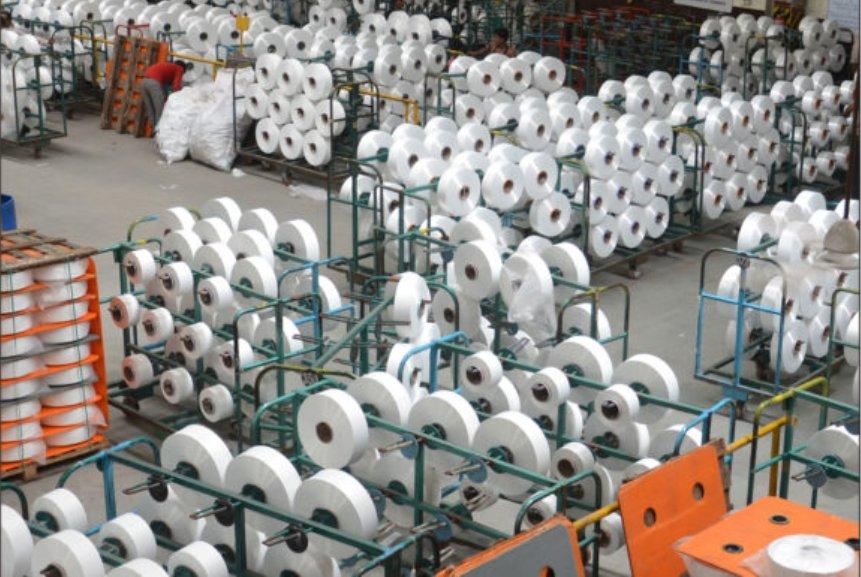
Filatex operates in the synthetic textile space, mostly polyester-based. Core products:
- Polyester Chips
- Partially Oriented Yarn (POY)
- Fully Drawn Yarn (FDY)
- Draw Textured Yarn (DTY)
- Air-Textured Yarn, Multifilament Crimp Yarns
- Narrow Woven Fabrics
They’ve also invested in:
- Steam Power Distribution Projects
- Plastic Recycling Projects (Texfil acquisition)
Their revenue is majorly B2B, serving downstream fabric manufacturers, exporters, and apparel brands.
4. Financials Overview
Metric | FY23 | FY24 | FY25 |
---|---|---|---|
Revenue (₹ Cr) | 4,304 | 4,286 | 4,252 |
EBITDA (₹ Cr) | 232 | 239 | 254 |
Net Profit (₹ Cr) | 90 | 111 | 135 |
EPS (₹) | 2.03 | 2.49 | 3.03 |
ROE (%) | 11% | 11% | 10.6% |
ROCE (%) | 13% | 13% | 14% |
Key Insight:
Flat topline with rising bottom-line = operational efficiency is kicking in. But growth is…slow like downloading a Netflix movie in a tunnel.
5. Valuation
- P/E Range for Peers: 15x–40x
- Filatex P/E (TTM): ~19x
- FY25 EPS Estimate: ₹3.03
- Fair Value Range: ₹60–₹80
EduInvesting Take: It’s fairly valued right now. Upside depends on margin expansion, new capacity kicking in, and how well Texfil (recycling arm) performs.
6. What’s Cooking – News, Triggers, Drama
- ₹235 Cr expansion project for POY/FDY/DTY
- ₹85 Cr steam power project — for cheaper captive power
- Acquired Texfil for ₹20 Cr to enter the recycled yarn biz
- Hybrid power project with Torrent Power
- Dividend of ₹0.25/share declared
- Ratings withdrawn & reassigned (CARE + India Ratings) = neutral stance from credit agencies
Red Flag:
SEBI compliance delay in 2024 led to fines. Not the end of the world, but not good optics either.
7. Balance Sheet
Metric (₹ Cr) | FY23 | FY24 | FY25 |
---|---|---|---|
Equity Capital | 44 | 44 | 44 |
Reserves | 1,055 | 1,160 | 1,287 |
Borrowings | 304 | 233 | 147 |
Total Liabilities | 2,113 | 2,098 | 2,276 |
Fixed Assets | 1,343 | 1,304 | 1,326 |
Insights:
- Debt has reduced by over ₹150 Cr in 2 years.
- Reserves are growing steadily.
- Capex is clearly happening — hope it converts to topline soon.
8. Cash Flow – Sab Number Game Hai
Metric (₹ Cr) | FY23 | FY24 | FY25 |
---|---|---|---|
Operating CF | 325 | 168 | 312 |
Investing CF | -114 | -102 | -160 |
Financing CF | -160 | -113 | -135 |
Net Cash Flow | 51 | -48 | 17 |
Commentary:
Strong CFO in FY25. They’re funding capex largely through internal accruals. Low reliance on fresh debt — brownie points from our side.
9. Ratios – Sexy or Stressy?
Ratio | FY23 | FY24 | FY25 |
---|---|---|---|
ROCE (%) | 13 | 13 | 14 |
ROE (%) | 11 | 11 | 10.6 |
Debt/Equity | 0.29 | 0.20 | 0.11 |
Inventory Days | 44 | 45 | 48 |
CCC (Days) | 11 | 13 | 3 |
Verdict:
Low working capital cycle (CCC of 3 days!) is super impressive. It’s a capital-intensive biz, but they’re running it like a startup — efficient AF.
10. P&L Breakdown – Show Me the Money
Metric (₹ Cr) | FY23 | FY24 | FY25 |
---|---|---|---|
Revenue | 4,304 | 4,286 | 4,252 |
Operating Profit | 232 | 239 | 254 |
OPM (%) | 5% | 6% | 6% |
Net Profit | 90 | 111 | 135 |
NPM (%) | 2.1% | 2.6% | 3.2% |
TL;DR:
Margins are trending up but still thin. They’re squeezing toothpaste from a half-empty tube and somehow still smiling.
11. Peer Comparison
Company | ROCE (%) | P/E | Sales (₹ Cr) | PAT (₹ Cr) | OPM (%) |
---|---|---|---|---|---|
KPR Mill | 19.8 | 51.4 | 6,388 | 797 | 19.5 |
Trident | 9.5 | 43.8 | 6,987 | 370 | 13.0 |
Vardhman | 11.2 | 16.4 | 9,785 | 883 | 12.9 |
Garware Tech | 24.7 | 40.1 | 1,540 | 231 | 20.7 |
Filatex India | 13.8 | 19.4 | 4,252 | 135 | 6.0 |
Conclusion:
Filatex is the low-cost, steady runner. Not the market leader, not a drag. Kind of like a polyester shirt — always there, never the star.
12. Miscellaneous – Shareholding, Promoters
Category | Jun ’22 | Mar ’24 | Jun ’25 |
---|---|---|---|
Promoter | 64.85% | 64.76% | 64.82% |
FIIs | 0.00% → 6.37% → 5.31% | ||
DIIs | 4.45% → 2.35% → 2.06% | ||
Public | 30.70% → 27.69% → 27.81% | ||
Shareholders | 47K → 89K → 1.12L |
Insight:
Retail is waking up. FII inflow peaked in 2022, but has stabilized. Promoters are holding steady — a good sign.
13. EduInvesting Verdict™
Filatex is a classic “underrated-but-stable” play. They’re disciplined with debt, expanding carefully, and staying relevant via recycling and hybrid energy.
But let’s be clear — this ain’t no garment glam stock like Aditya Birla Fashion. Margins are thin, competition is intense, and polyester demand is linked to global fashion & oil prices.
If you’re into slow compounders, capex-efficiency, and under-the-radar consistency, this one could spin a tidy story.
If you’re here for 10x fireworks — maybe scroll further down the textile aisle.
Metadata
– Written by EduInvesting Research Desk | 18 July 2025
– Tags: Filatex India, Textile Stocks, Polyester Yarn, Capex Plan, Dahej Plant, Synthetic Yarn, Smallcap India