1. At a Glance
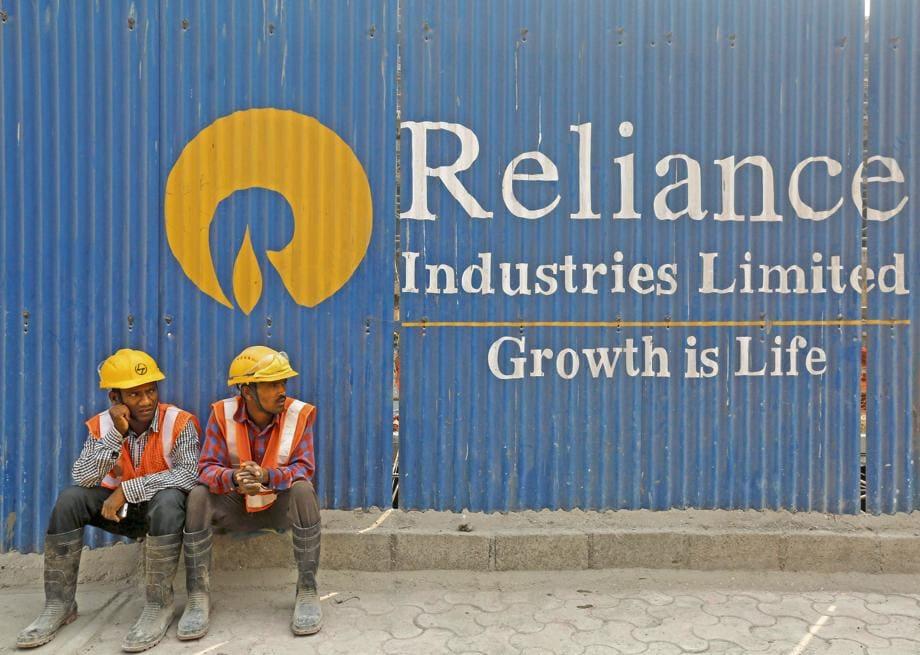
RIIL is a midcap with the Reliance brand stamp, but not the Reliance returns. Despite being a part of the RIL universe (45.43% holding), the company has posted declining revenues, poor margins, and relies heavily on “Other Income” to survive. Infra? More like infra-red: invisible and barely warm.
2. Introduction with Hook
Picture a Reliance company. Now strip away the telecom towers, the refinery cash flows, and Mukesh bhai’s speeches. What you’re left with is Reliance Industrial Infrastructure Ltd—the Reliance Group’s quietest portfolio member.
- 10-Year Sales CAGR: -6%
- TTM Revenue: ₹50 Cr
- P/E: 118
- Operating Margin: -23%
- ROE: 2.57%
If RIIL were at a Reliance family dinner, it would be at the kids’ table—with no dessert.
3. Business Model (WTF Do They Even Do?)
RIIL is primarily involved in setting up and operating industrial infrastructure facilities—specifically:
- Pipelines (e.g. Chembur–Patalganga line)
- Construction machinery leasing
- IT support for infrastructure projects
Operations are centered around Mumbai, Rasayani (Maharashtra), Surat and Jamnagar (Gujarat)—areas close to RIL’s core refineries and projects.
Translation: It’s a Reliance ecosystem-support entity—read: glorified contractor for its parent.
4. Financials Overview
| Metric | FY21 | FY22 | FY23 | FY24 | FY25 |
|---|---|---|---|---|---|
| Revenue (₹ Cr) | 54 | 65 | 68 | 58 | 49 |
| Net Profit (₹ Cr) | 10 | 8 | 18 | 13 | 12 |
| Operating Profit (₹ Cr) | 5 | 4 | 3 | -6 | -12 |
| OPM % | 10% | 7% | 4% | -11% | -24% |
| Other Income (₹ Cr) | 18 | 17 | 23 | 28 | 27 |
They make more money from interest/dividends than actual business ops. That’s not infra, that’s an FD.
5. Valuation
| Metric | Value |
|---|---|
| CMP | ₹946 |
| Market Cap | ₹1,430 Cr |
| EPS (TTM) | ₹8.05 |
| P/E | 118 |
| Book Value | ₹306 |
| P/B | 3.09x |
| Dividend Yield | 0.37% |
EduInvesting Fair Value Range: ₹300 – ₹450
(current price implies excessive future growth… which is nowhere in sight)
6. What’s Cooking – News, Triggers, Drama
- Q1 FY26: Revenue ₹12.46 Cr, Net Profit ₹3.1 Cr (but operating loss of ₹1.99 Cr)
- No expansion plans announced – business remains flatlined
- Dependence on RIL: 90%+ of revenue is essentially internal contracting work
- Buzz: Speculators occasionally dream of a Reliance restructuring or asset injection. Reality? Zilch.
7. Balance Sheet
| Metric | FY23 | FY24 | FY25 |
|---|---|---|---|
| Equity Capital | ₹15 Cr | ₹15 Cr | ₹15 Cr |
| Reserves | ₹416 Cr | ₹456 Cr | ₹447 Cr |
| Borrowings | ₹0 | ₹0 | ₹0 |
| Other Liabilities | ₹45 Cr | ₹62 Cr | ₹75 Cr |
| Net Worth | ₹431 Cr | ₹471 Cr | ₹462 Cr |
| Investments | ₹268 Cr | ₹321 Cr | ₹308 Cr |
Clean Balance Sheet, but revenue growth and asset utilization are tragic.
8. Cash Flow – Sab Number Game Hai
| Year | CFO (₹ Cr) | CFI (₹ Cr) | Net Flow (₹ Cr) |
|---|---|---|---|
| FY23 | ₹23 | ₹-19 | ₹-0.0 |
| FY24 | ₹2 | ₹3 | ₹-0.0 |
| FY25 | ₹-3 | ₹9 | ₹0 |
Cash flows say it all: flat, unambitious, non-growth. Just making enough to exist.
9. Ratios – Sexy or Stressy?
| Ratio | FY23 | FY24 | FY25 |
|---|---|---|---|
| ROCE (%) | 3% | 4% | 3% |
| ROE (%) | 3% | 3% | 2.6% |
| OPM (%) | 4% | -11% | -24% |
| Debt/Equity | 0 | 0 | 0 |
| EPS (₹) | 11.64 | 8.82 | 7.93 |
Operating margins went from thin to negative. Without “Other Income,” this would be underwater.
10. P&L Breakdown – Show Me the Money
| Metric | FY23 | FY24 | FY25 |
|---|---|---|---|
| Revenue (₹ Cr) | 68 | 58 | 49 |
| Operating Profit | ₹3 Cr | ₹-6 Cr | ₹-12 Cr |
| Other Income | ₹23 Cr | ₹28 Cr | ₹27 Cr |
| Net Profit | ₹18 Cr | ₹13 Cr | ₹12 Cr |
| Dividend Payout % | 30% | 40% | 44% |
Bottom line? It’s a glorified dividend play… backed by other income.
11. Peer Comparison
| Company | CMP ₹ | P/E | ROE % | Sales (Cr) | PAT (Cr) | OPM % | Mcap (Cr) |
|---|---|---|---|---|---|---|---|
| Container Corp | 620 | 36 | 10.8 | 8,887 | 1,313 | 21.7% | 47,186 |
| Transport Corp | 1,226 | 23 | 19.8 | 4,492 | 411 | 10.3% | 9,568 |
| Blue Dart | 6,913 | 65 | 17.2 | 5,720 | 252 | 15.2% | 16,447 |
| RIIL | 946 | 118 | 2.6 | 49 | 12 | -23% | 1,430 |
Everyone’s shipping profits. RIIL’s shipping excuses.
12. Miscellaneous – Shareholding, Promoters
- Promoter Holding: 45.43% (RIL)
- Public Holding: 53.32%
- FIIs: 1.24%
- No dilution or buybacks
- Dividend: ₹3.5 per share in FY25 (44% payout)
Fun Fact: Shareholders are 86,000+ strong—mostly hoping for a “Reliance Magic Event.”
13. EduInvesting Verdict™
RIIL is a classic case of “Reliance by name, reliance by hope.” Beneath the glossy logo is a company with:
- Shrinking revenues
- Operating losses
- 90% of earnings from treasury ops (not operations)
- No growth plans
Unless RIL decides to inject assets or spin-off some exciting vertical (which they haven’t since 1988), this remains a zombie stock with a premium surname.
Not a turnaround story. Not a growth stock. Just a parking lot for hope and dividend crumbs.
Metadata
– Written by EduInvesting Analyst Team | 16 July 2025
– Tags: Reliance Industrial Infrastructure Ltd, RIIL, Infrastructure Stocks, RIL Subsidiary, Dividend Play, Microcap Infra


