1. At a Glance
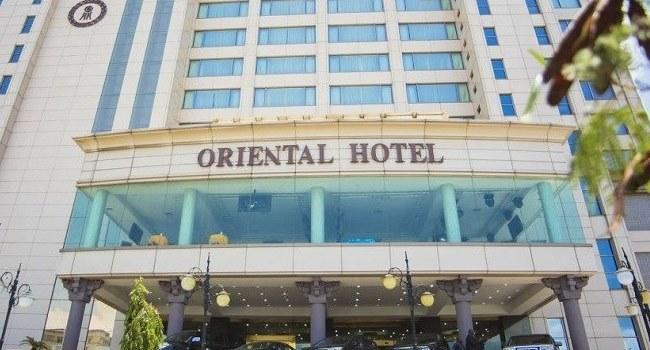
Oriental Hotels Ltd (OHL), a Taj-branded hotel chain with 7 properties across South India, has bounced back from COVID gloom with a 47.6% 5-year profit CAGR and expanding margins. But with a sky-high P/E and middling ROE, is the recovery baked in, or is there more room service upside?
2. Introduction with Hook
Imagine a luxurious Taj suite overlooking the Bay of Bengal, with linen so soft even your regrets feel cushy. Now imagine the company behind it… trading at 62.5x earnings. Oriental Hotels Ltd, an associate of IHCL (Taj Group), is the quiet operator of seven premium hotels including Taj Coromandel and Taj Malabar.
- 5-year profit CAGR: 47.6%
- 3-year sales CAGR: 26%
- ROCE: 9.45% (ehh… could be better)
Can a regional hospitality operator command such a royal multiple, or is this just investor FOMO in a linen robe?
3. Business Model (WTF Do They Even Do?)
Oriental Hotels Ltd runs 7 premium hotels across Tamil Nadu, Kerala, Karnataka—through a mix of owned, leased, and licensed properties. All operate under the Taj, Vivanta, Gateway, and SeleQtions banners, courtesy of its association with Indian Hotels Company Ltd (IHCL), which holds a 67.56% stake.
Properties Breakdown:
| Hotel Name | Rooms | Suites | City |
|---|---|---|---|
| Taj Coromandel | 212 | 11 | Chennai |
| Taj Fisherman’s Cove Resort & Spa | 149 | 2 | Chennai (Beach) |
| Taj Malabar Resort & Spa | 95 | 9 | Kochi |
| Vivanta Coimbatore | 178 | 9 | Coimbatore |
| Gateway Hotel, Madurai | 63 | 2 | Madurai |
| Gateway Coonoor | 32 | 4 | Coonoor |
| Gateway Old Port, Mangalore | 96 | 5 | Mangalore |
All are managed under IHCL’s brand licensing + management fee model. This means:
They own the rooms. IHCL owns the aura.
4. Financials Overview
Let’s pull back the curtain on 10 years of revenue and profitability.
| Metric | FY20 | FY21 | FY22 | FY23 | FY24 | FY25 |
|---|---|---|---|---|---|---|
| Revenue (₹ Cr) | 291 | 116 | 219 | 395 | 393 | 440 |
| Net Profit (₹ Cr) | -8 | -71 | -20 | 54 | 50 | 39 |
| EBITDA (₹ Cr) | 38 | -32 | 23 | 112 | 98 | 110 |
| OPM (%) | 13% | -28% | 11% | 29% | 25% | 25% |
| ROCE (%) | 2% | -7% | 1% | 13% | 11% | 9% |
Narrative: From COVID coma to recovery drama. Profits went from -₹71 Cr (FY21) to ₹50 Cr+ levels. But margins in FY25 dipped slightly. The brand shine is back, but the pricing power needs reinforcement.
5. Valuation
Current stock price: ₹165
Market Cap: ₹2,950 Cr
EPS (TTM): ₹2.64
P/E: 62.5
Book Value: ₹38.2
P/B: 4.32
Fair Value Range Estimation:
| Valuation Method | Multiple | Value per Share |
|---|---|---|
| PE-based (25x FY26E EPS ₹3.0) | 25x | ₹75 |
| EV/EBITDA (16x FY26E EBITDA ₹130 Cr) | ₹2100 Cr + ₹183 Cr debt = ₹2,283 Cr EV → ₹128/share | |
| DCF (modest occupancy growth) | — | ₹115–₹125 |
EduInvesting FV Range: ₹100 – ₹130
That means current price is… probably on the house already.
6. What’s Cooking – News, Triggers, Drama
- Q1 FY26: PAT of ₹8.71 Cr (+26% YoY). Margin drop due to seasonal weakness but revenue at all-time high.
- No new hotels expected: Capital-light, sure, but also… growth-light?
- Tourism rebound: Strong tailwinds from domestic travel and MICE segment (Meetings, Incentives, Conferences, Exhibitions).
- Capex: Minimal. Focus on sweating existing assets.
- Risks: High dependence on Tamil Nadu, rising wage/utility costs, and luxury tax volatility.
7. Balance Sheet
| Metric | FY23 | FY24 | FY25 |
|---|---|---|---|
| Equity Capital | ₹18 Cr | ₹18 Cr | ₹18 Cr |
| Reserves | ₹521 Cr | ₹601 Cr | ₹664 Cr |
| Borrowings | ₹215 Cr | ₹202 Cr | ₹183 Cr |
| Total Liabilities | ₹828 Cr | ₹890 Cr | ₹950 Cr |
| Net Worth | ₹539 Cr | ₹619 Cr | ₹682 Cr |
| Debt to Equity | 0.4x | 0.33x | 0.27x |
Key Takeaways:
- De-leveraging is real.
- No equity dilution.
- Good reserve build-up post-COVID.
8. Cash Flow – Sab Number Game Hai
| Cash Flow (₹ Cr) | FY23 | FY24 | FY25 |
|---|---|---|---|
| CFO (Operating) | 104 | 91 | 100 |
| CFI (Investing) | -10 | -57 | -56 |
| CFF (Financing) | -105 | -40 | -46 |
| Net Cash Flow | -10 | -7 | -2 |
Interpretation:
- Strong operating cash but negative investing means upgrades or refurbishments.
- Financing cash outflow = loan repayment + dividends.
- Net cash stays flat. No aggressive expansion.
9. Ratios – Sexy or Stressy?
| Ratio | FY23 | FY24 | FY25 |
|---|---|---|---|
| ROCE | 13% | 11% | 9% |
| ROE | 10% | 8% | 6% |
| Debtor Days | 17 | 13 | 19 |
| Inventory Days | 86 | 90 | 95 |
| OPM | 29% | 25% | 25% |
| Debt/Equity | 0.4x | 0.33x | 0.27x |
Verdict? Sexy-ish. Margins are respectable. Returns falling mildly. Leverage low.
10. P&L Breakdown – Show Me the Money
| Metric | FY23 | FY24 | FY25 |
|---|---|---|---|
| Revenue | ₹395 Cr | ₹393 Cr | ₹440 Cr |
| Operating Profit | ₹112 Cr | ₹98 Cr | ₹110 Cr |
| Net Profit | ₹54 Cr | ₹50 Cr | ₹39 Cr |
| EPS | ₹3.04 | ₹2.78 | ₹2.20 |
| Dividend Payout % | 16% | 18% | 23% |
Decent recovery post-COVID, but FY25 looks slightly fatigued on net profits.
11. Peer Comparison
| Company | CMP ₹ | P/E | ROE | Sales ₹ Cr | PAT ₹ Cr | OPM % | Mcap ₹ Cr |
|---|---|---|---|---|---|---|---|
| Indian Hotels | 751 | 64 | 16% | 8,334 | 1,661 | 33% | 1,06,720 |
| EIH Ltd | 380 | 31 | 18% | 2,743 | 759 | 37% | 23,801 |
| Chalet Hotels | 890 | 136 | 6% | 1,717 | 142 | 43% | 19,465 |
| Oriental Hotels | 165 | 62.5 | 6% | 465 | 47 | 27% | 2,950 |
Verdict: Valuation is punchy for a company that’s regional and modest in size. OPMs are lower vs peers. Indian Hotels and EIH dominate with scale.
12. Miscellaneous – Shareholding, Promoters
- Promoter Holding: 67.56% (IHCL) – Solid parentage.
- FII Holding: 0.42% – Foreigners sniffing around.
- DII Holding: 2.68%
- Public Holding: 29.34%
- Shareholders: 77,987 and growing steadily
- Dividend Yield: 0.3% – Meh.
13. EduInvesting Verdict™
Oriental Hotels Ltd is the loyal middle child of the IHCL family—trusted, predictable, never flashy. The recovery post-COVID is real, but so is the premium valuation. While Taj’s brand lends a five-star shine, earnings are still playing catch-up to the price.
Great brand + Decent balance sheet + Saturated valuation = Meh with Potential.
If they can unlock one more high-margin property or kick off a south Indian MICE boom, there’s upside. Otherwise, investors might be paying buffet rates for à la carte earnings.
Metadata
– Written by EduInvesting Analyst Team | 16 July 2025
– Tags: Oriental Hotels, Taj Group, Hospitality Stocks, South India, IHCL, Midcap Analysis, Hotel Stocks, Tourism Revival


