Tolins Tyres FY26: Revenue Grows 12%, But the Retread Tread Is Wearing Thin
Spotted a factual error — a wrong number, date, or fact? Tell us and we will check the source.
General information and entertainment, not investment advice. The author is not a SEBI-registered adviser or research analyst. No recommendation, no promised returns. Markets carry risk including loss of capital. Figures may not be current. Consult a registered adviser before acting.
1 — At a Glance
Figures are consolidated, in ₹ crore.
Tolins Tyres closed FY26 with revenue of ₹327.12 Cr — up 12% from ₹292.45 Cr in FY25. The topline cooperated; everything below it was less enthusiastic. EBITDA fell from ₹57.91 Cr to ₹47.80 Cr, a 519 basis-point margin compression that arrived on the same train as raw material cost volatility, elongated receivable cycles, and a structural GST realignment in the retread segment. PAT landed at ₹35.69 Cr, down from ₹38.68 Cr the prior year.
The attention signal: operating cash flow was negative ₹39.77 Cr for the second consecutive year (FY25: -₹61.47 Cr). A business growing at 12% that has delivered negative operating cash flow in back-to-back years is deploying capital faster than it is collecting it — working capital days stretched from 258 to 327, per the filings.
The tension: tyre volumes grew 36% (management, concall), management cited raw material volatility and GST changes as causes, and the balance sheet remains nearly debt-free at ₹10.83 Cr borrowings against ₹361.24 Cr in equity. The company is not struggling to survive; it is struggling to convert growth into cash.
One wisdom drop: a business can have a growth story and a cash story running simultaneously in opposite directions. The ratio that matters, eventually, is which one wins.
2 — Introduction
Tolins Tyres Limited is a Kerala-based manufacturer of tyre retreading products and tyres, founded in 1982 and converted to a listed entity in September 2024 following an IPO that raised ₹230 Cr. The company operates under the “Tolins Tyres” brand and holds ISO 9001:2015 and IATF 16949:2016 certifications.
The group structure expanded meaningfully over the past two years. Tolin Rubbers Private Limited and Tolins Tyres LLC (a wholly-owned UAE subsidiary in Ras Al Khaimah) were acquired in 2023. In October 2025, the company added Terra Rubber Private Limited — a rubber recycling subsidiary — to the fold. The holding company’s audited results, along with all three subsidiaries, form the consolidated entity assessed here.
FY26 marked the company’s first full year as a public entity. The board met on May 28, 2026 to approve audited results for the quarter and year ended March 31, 2026. New internal auditors (M/s. Joseph Cyriac & Company) and cost auditors (M/s. BBS & Associates) were appointed for FY2026-27 at the same meeting. In June 2026, the company announced participation in the 10th Edition of the Truck, Trailer & Tyre (TTT) Expo in Jaipur.
On the credit rating front, CARE Ratings downgraded the company’s long-term bank facilities from CARE BB-; Stable to CARE B+; Stable; Issuer Not Cooperating in June 2026, citing the company’s failure to provide monitoring information and noting decline in overall profitability and increased debt levels in FY26 abridged financials. The short-term facilities remained at CARE A4; Issuer Not Cooperating.
3 — Business Model: WTF Do They Even Do?
Tolins sits at an unusual intersection of the tyre industry: it is not primarily a tyre manufacturer, though it makes tyres. Its dominant business — roughly 62% of standalone operational revenue by the FY26 presentation — is tyre retreading materials, specifically Precured Tread Rubber (PCTR).
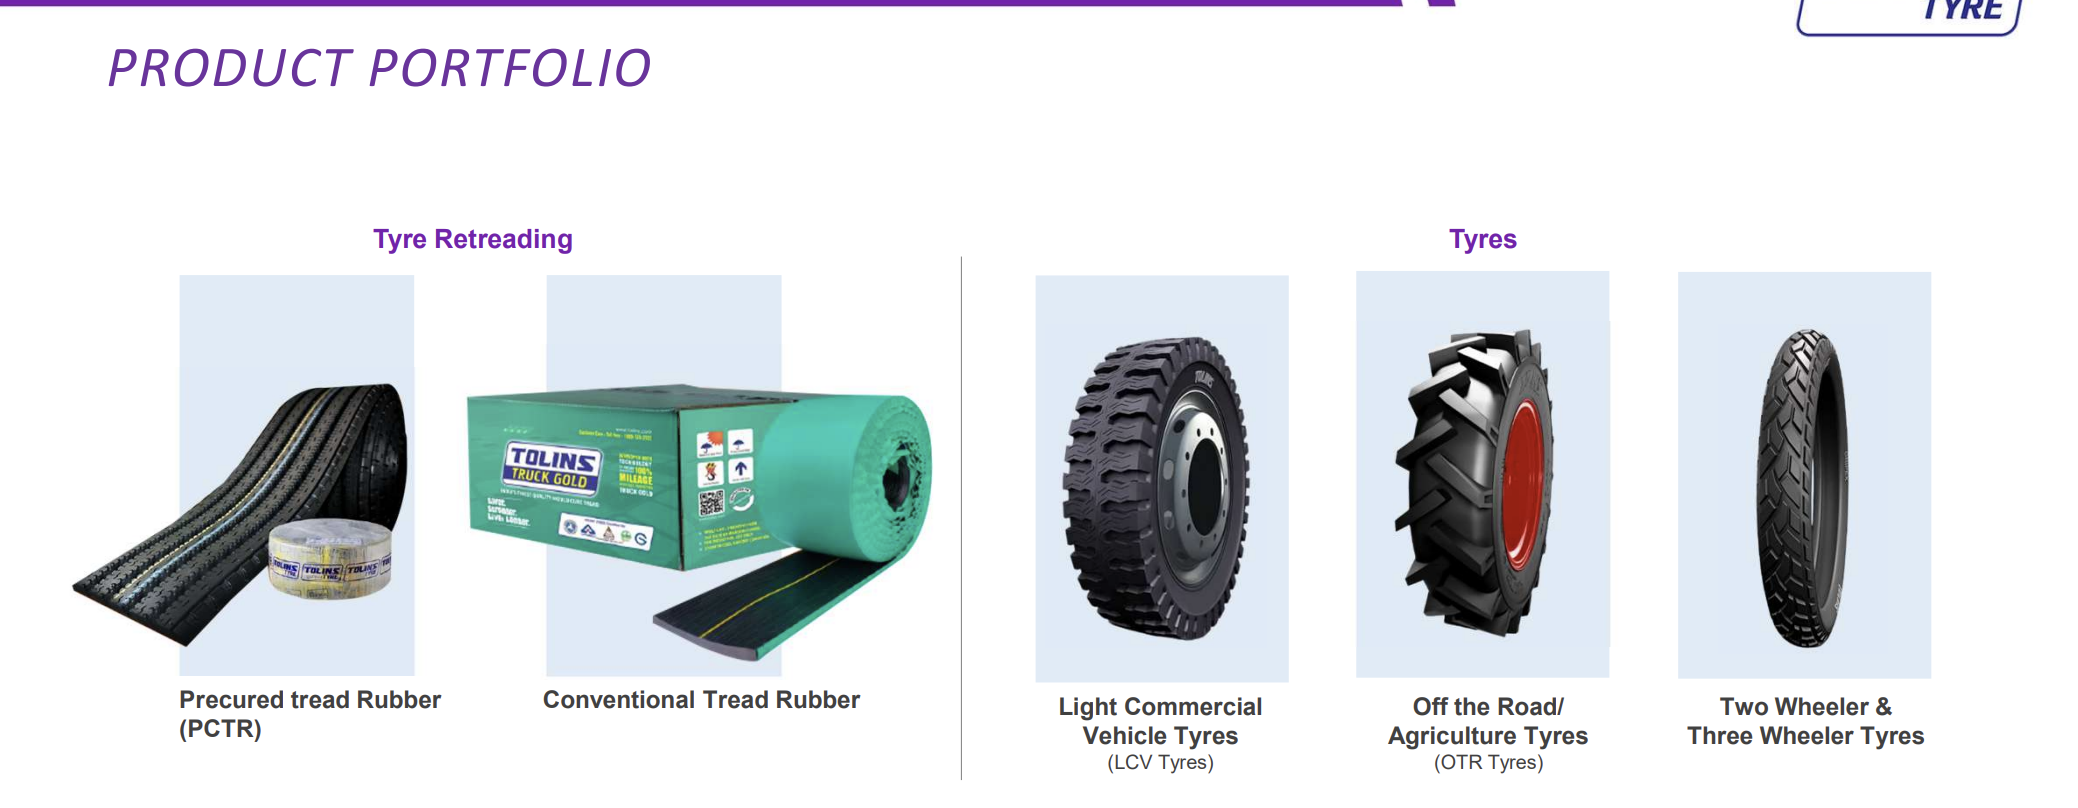
PCTR is the rubber strip that replaces the worn tread on a used tyre casing, extending its life at a fraction of the cost of a new tyre. Think of it as a tyre’s second act — and Tolins is one of the scriptwriters. The product serves the commercial vehicle fleet segment, where retreading economics make hard sense in normal regulatory conditions.
The remaining ~38% of revenue comes from tyres proper: Light Commercial Vehicle (LCV) tyres, Off-the-Road/Agricultural tyres, and two/three-wheeler tyres. The agricultural segment received a new addition this year — heavy-duty tractor rear tyres — which management noted were receiving “encouraging response through the dealer network,” per the concall.
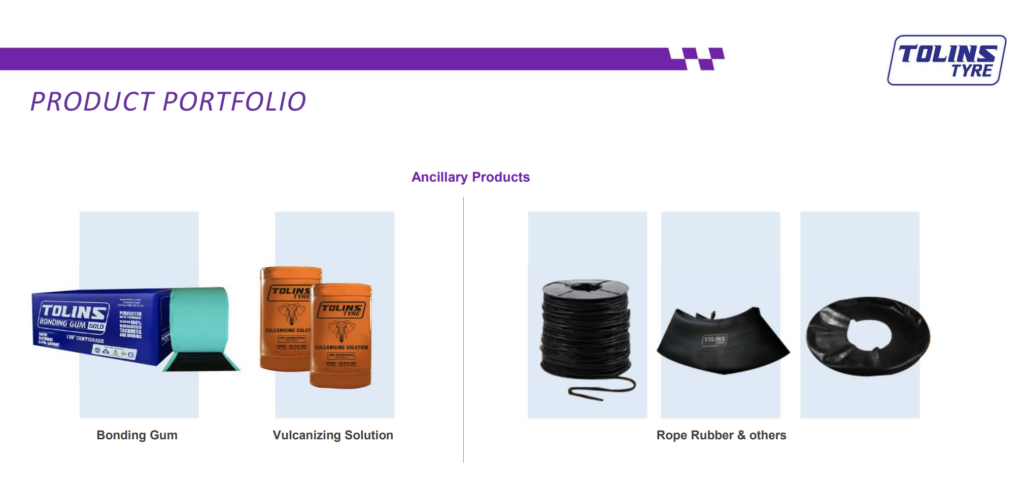
Alongside these, backward integration supplies ancillary products: Bonding Gum, Vulcanizing Solutions, Tyre Flaps, Tubes, and Rubber Compound — the connective tissue that holds the retreading process together.
The geographic footprint is domestic-dominant: India contributed ₹273.98 Cr of the consolidated ₹327.12 Cr in FY26 revenue (roughly 84%), with the UAE subsidiary accounting for ₹53.14 Cr (roughly 16%), per the consolidated segment data. The company exports to 40 countries including the Middle East, East Africa, and the United States.
Three manufacturing facilities — two in Kalady, Kerala, and one in UAE — span 221,214 square feet. Annual installed capacity: 12,486 tonnes of tread rubber, 1.51 million tyre units, and 17,160 tonnes of rubber compounds. A network of 8 depots and 3,737 dealers covers domestic distribution. A Gujarat depot launched December 2025 marked the company’s push into Western India.
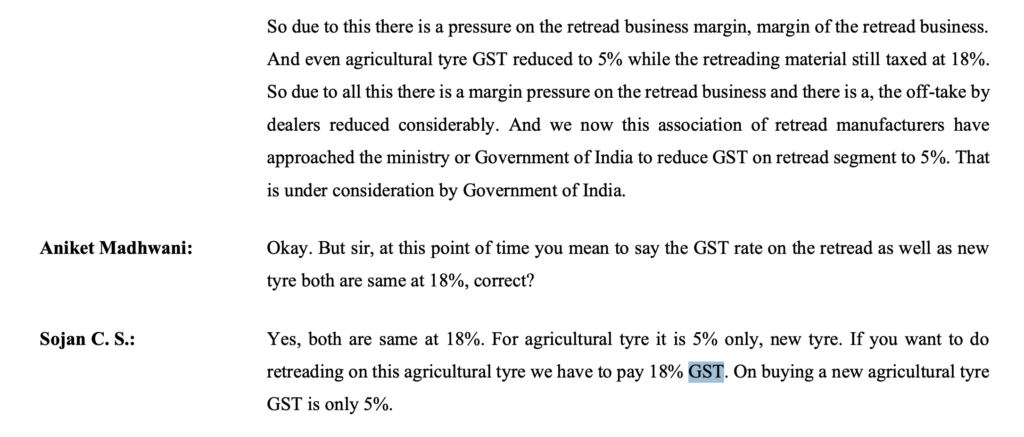
The model’s stress point is visible in the FY26 numbers: the GST structure that made retreading economically attractive relative to new tyres was partially dismantled. New tyres for commercial vehicles had GST reduced from 28% to 18% — parity with retreading materials. For agricultural tyres, new tyres sit at 5% GST while retreading materials remain at 18%, creating a 13-percentage-point cost inversion. Management has approached the government for correction, per the concall. The economics of the core product are a policy variable now.
4 — Financials Overview
Figures are consolidated, in ₹ crore.
Quarterly Results — Q4 FY26 vs Q4 FY25 and Q3 FY26
Metric
Q4 FY26
YoY
QoQ
Revenue
77.99
+12.2%
-16.4%
EBITDA
11.22
-17.3%
-20.9%
PAT
8.94
-3.7%
-14.8%
EPS (not annualised)
₹2.26
vs ₹2.56
vs ₹2.66
Q4 was the company’s softest quarter on operating profitability, with EBITDA margin at 14.39% versus 19.51% in Q4 FY25 — a 512 basis-point compression. Revenue grew; margin did not follow.
Annual Results — FY26 vs FY25
Metric
FY26
FY25
YoY
Revenue
327.12
292.45
+11.9%
EBITDA
47.80
57.91
-17.5%
PAT
35.69
38.68
-7.7%
EPS
₹9.03
₹9.79
-7.8%
Concall Colour (Jun 2026)
Management attributed margin pressure and cash conversion stress to “volatility in raw material prices, higher inventory holding, and elongated receivable cycles amid geopolitical uncertainties,” per the concall transcript. On volumes, management pushed back on “weak numbers” framing by citing tyre volume growth of ~36% YoY (to 5,35,870 units) and PCTR volume growth of ~10%, with bonding gum and flap volumes up ~56% — noting that “factory is there doing 36% growth in tyres… but the top lines depend upon the final selling price,” per the concall.
On the UAE operation, management explicitly described a choice to constrain growth due to credit risk: “if we do more volumes then our receivables will also go high. So, we are controlling the credit in that market,” per the concall. The CFO stated IPO funds were deployed into working capital to sustain supply levels and protect the dealer network.
On FY27, management’s guidance was conservative: targeting maintenance of FY26 performance levels, with recovery anticipated from Q3 onward pending stabilisation of geopolitical and logistics conditions, per the concall.
5 — Market Expectations & Historical Multiples
This section describes how the market is currently pricing the