Rubfila International FY26: Revenue Crosses ₹600 Cr, But the Rubber Meets the Road on Margins
Spotted a factual error — a wrong number, date, or fact? Tell us and we will check the source.
General information and entertainment, not investment advice. The author is not a SEBI-registered adviser or research analyst. No recommendation, no promised returns. Markets carry risk including loss of capital. Figures may not be current. Consult a registered adviser before acting.
1 — At a Glance
Rubfila International closed FY26 with consolidated revenue of ₹602 Cr, a 9.5% advance on FY25’s ₹550 Cr. That’s the good news. The less cheerful number sits two lines below: net profit fell to ₹26.6 Cr from ₹29.4 Cr — a 9.6% decline — even as the top line kept climbing. Operating margin compressed from 8.2% in FY25 to 6.7% in FY26, a 150 bps squeeze on a business that had already watched margins erode from the 15% territory of FY18. The latest quarter (Mar 2026) delivered revenue of ₹160.6 Cr — the strongest in the trailing thirteen quarters — with PAT of ₹6.4 Cr.
The balance sheet is almost debt-free; borrowings stand at ₹1 Cr against a net worth of ₹310 Cr at the consolidated level. ROCE sits at 12.3%, ROE at 8.8%. The market pays 14.7x trailing earnings against an industry median P/E of 24.9x.
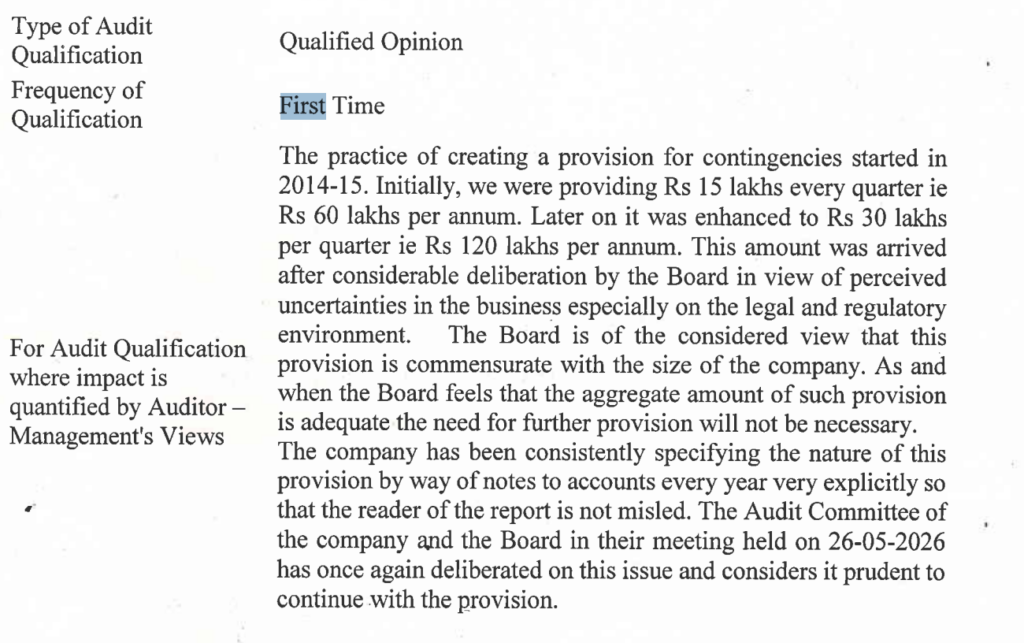
One number demands attention before proceeding: the auditors issued a qualified opinion — both standalone and consolidated — for the first time in FY26, flagging a ₹13.49 Cr “Provision for Contingencies” accumulated over eleven years whose underlying obligation, per the audit report, cannot be established under Ind AS 37. Management characterises it as prudent provision for unknown liabilities; the auditors disagree. The tension between a clean balance sheet and a cloudy provision ledger is the central governance story of this period.
Figures are consolidated, in ₹ crore.
2 — Introduction
Rubfila International Ltd was incorporated in 1993 and is headquartered at Kanjikode, Palakkad, Kerala. It is part of the Finquest Group, Mumbai, a conglomerate with interests in finance, textiles, and paper, and the owner of brands including Reid & Taylor and Digjam.
The company operates manufacturing facilities at two locations: Kanjikode in Kerala and Swaminathapuram in the Dindigul district of Tamil Nadu. The consolidated entity also includes a wholly owned subsidiary, Premier Tissues India Limited, whose business segment is paper tissue.
In May 2023, Rubfila commissioned a corrugated box manufacturing plant in Tamil Nadu, adding a third reportable segment — Corrugated Carton Box — to the existing Latex Rubber Thread and the subsidiary’s Paper Tissue. This diversification into packaging was aimed at meeting captive demand.
The FY26 annual results were approved by the board on 26 May 2026. The board recommended a final dividend of ₹2 per share (40% on face value of ₹5), subject to shareholder approval at the AGM. A GST demand notice of ₹2.1 Cr was received in August 2024 — that remains the material open tax matter noted in the announcements.
3 — Business Model: WTF Do They Even Do?
Rubfila makes rubber thread. Not a glamorous sentence, but an accurate one. The company is a manufacturer and exporter of extruded Round Latex Rubber Thread, certified under ISO 9001-2015, ISO 14001-2015-2024, and OEKO Tex STANDARD 100. It is recognised as an Export House by the Ministry of Commerce, with customers across 30 countries.
The product line runs the full alphabet of elasticity:
Talc Coated Rubber Thread — the workhorse, used in elastic tapes for innerwear, shorts, sportswear, sock tops, diapers, shoe uppers, and headbands
Silicon Coated Rubber Thread — a smoother, more premium cousin
Coloured Rubber Thread — for toys like koosh balls and doll hair (yes, Rubfila is in the toy hair business)
Furniture Grade Rubber Thread — webbing for chairs, sofas, and things you sit on
Medical-grade variants — used in catheters, poly catheter manufacturing, medical nettings, braids, and laces
Rubber Thread in Bobbins — the delivery format for industrial customers
The installed capacity as of FY25 stood at 27,500 MT per annum across eleven production lines. The FY26 data sheet records the latest capacity figure available from prior disclosures at that level.
The business operates across two geographies with notably different economics: in FY23 (the most recently detailed data available), exports accounted for roughly 22% of revenue against a domestic share of ~78%. Asia outside India takes the largest export slice (~15%), with the Americas contributing ~5%.
What keeps this model interesting is not the product — rubber thread is not disrupting anything — but the end-market spread. Elastic tape for innerwear, catheter manufacturing, fishing lures, furniture webbing, doll hair, and meatpacking live in neighbourhoods so different from each other that a demand dip in one rarely cascades into another. The subsidiary’s paper tissue adds a second unrelated growth vector. The corrugated box plant adds a third — though it is presently captive.
The sector’s eternal question: in a commodity-adjacent business, does scale protect margins, or does it merely increase the volume of the problem?
4 — Financials Overview
Figures are consolidated, in ₹ crore. The results below cover the annual period FY26 (year ended 31 March 2026) alongside the latest quarter (Mar 2026, Q4 FY26).
Q4 EBITDA computed from the quarterly data: Operating Profit + Other Income less adjustments not available at quarterly granularity; EBITDA approximated as PBT + Interest + Depreciation for comparability.
Revenue at the quarterly level hit ₹160.6 Cr — the highest quarter in the data set — yet PAT at ₹6.4 Cr ran 22.7% below the year-ago quarter. The tax rate in Mar 2026 was 37.3%, notably above the company’s ~26% run rate in preceding quarters; this elevated tax rate accounts for a meaningful portion of the PAT compression in Q4.
For the full year, the EPS on 5.43 Cr shares was ₹4.90. This is the full-year figure, not a quarterly annualisation.
5 — Market Expectations & Historical Multiples
This section describes how the market is currently pricing the company and how that compares with its own history and peer group. It is descriptive, not predictive.