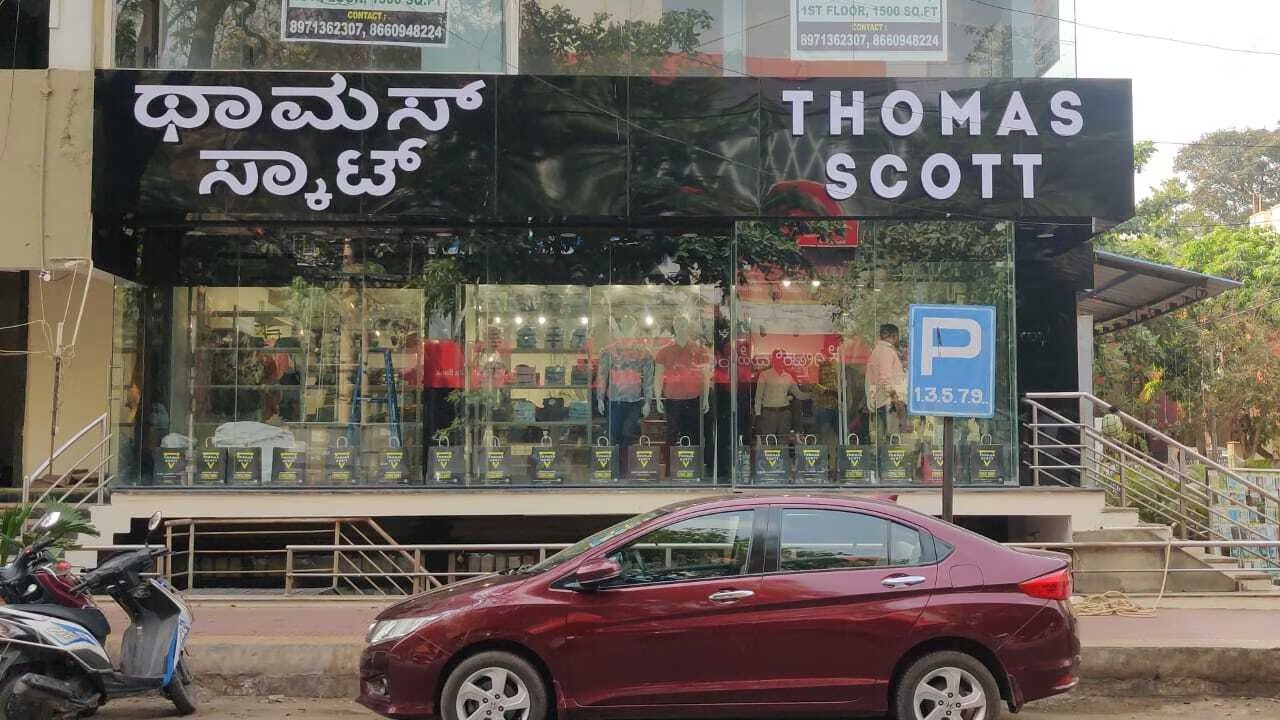
Thomas Scott: From Textile Job-Work to ₹255 Cr Revenue Rollercoaster
Spotted a factual error — a wrong number, date, or fact? Tell us and we will check the source.
General information and entertainment, not investment advice. The author is not a SEBI-registered adviser or research analyst. No recommendation, no promised returns. Markets carry risk including loss of capital. Figures may not be current. Consult a registered adviser before acting.
A decade-old contract manufacturer pivoted into a “technology-enabled fashion retailer,” reimagined itself at scale, grew to ₹255 Cr revenues in FY26 — but the bill for that growth is showing up in cash flow and borrowings, not in the checking account.
The narrative: ₹77.8 Cr quarterly revenue in Q4, up 63% YoY. Profit grew 63% too. But operating cash flow remains negative (₹26.76 Cr outflow in FY26), and borrowings jumped from ₹13.5 Cr to ₹46.4 Cr year-on-year. The company funded growth with debt against a future insurance claim, not earned cash.
ROE stands at 16.7%, ROCE at 20.5% — respectable. But the multiple (P/E 21.4) sits above the peer median (22.2x), on lower margins and smaller scale than larger competitors. The real tension: a ₹22 Cr insurance receivable sitting in the balance sheet, keeping short-term debt inflated and cash flow analysis opaque.
Can a business that doesn’t throw off cash sustain a 60%+ growth rate? That’s the question the next 12 months will answer.
2. Introduction
Thomas Scott (India) Ltd, incorporated in 2010, began life as a textile contract manufacturer for premium brands — think Raymond, Max, Shoppers Stop. By FY24 it was still under ₹100 Cr revenue. Then velocity happened.
In the past 24 months, the company repositioned itself as a direct retailer, launched 15+ brands, expanded SKU count from ~4,000 to 50,000, signed exclusive partnerships with Myntra, Amazon, and other e-commerce channels, and opened a network of fulfillment centers across four geographies.
FY25 (year ended March 2025) saw sales leap 58% to ₹144 Cr. FY26 continued at ₹255 Cr, a 77% jump. That growth rate is rare in apparel retail — but it also has a cost.
The business is young, the model is unproven at scale, and the balance sheet is doing the heavy lifting. Two fire incidents in FY26 (Gurgaon and Bhiwandi warehouses) knocked inventory and required insurance claims.
3. Business Model: WTF Do They Even Do?
The company runs three revenue streams, but the mix is skewed.
B2B Contract Manufacturing (₹15 Cr, 5.9% of FY26 revenue): still makes shirts, bottoms, and bags for established brands. Margins are thin; this is where the legacy sits.
B2C Own Brands (₹91 Cr, 37.8%): Thomas Scott is the flagship. The company also owns brands acquired or licensed (smaller portfolio items). Retail average selling price targets ₹999 per shirt, but wholesale deals to marketplaces happen at 30–40% discounts. The economics are murky by design — management refuses to disclose brand-level margins.
B2C Licensed & Other Brands (₹148 Cr, 56.3%): this is the growth engine. Myntra brands (FCUK, Nautica, French Connection, Kenneth Cole, Aeropostale), Amazon brands, Ajio brands, Namshi brands. Thomas Scott is essentially a merchant fulfillment partner, buying/consigning inventory and moving it through these platforms.
The model hinges on data. The company has built internal AI tools (thread.ai for trend forecasting, catalog.ai for visual generation) to predict demand and launch products fast. The pitch: “build-for-demand” = test small batches, scale winners, never get stuck with dead stock.
Manufacturing is spread across four facilities (Solapur, Bangalore, Gurgaon, Kolkata). The company claims to run them at max capacity (140k units/month capacity) and is using “captive rented capacity” (job-work at third-party vendors under Thomas Scott’s QA control) for overflow.
The real weakness: only 7% of Thomas Scott brand revenue comes from owned retail (6 stores in Bangalore); 93% is online. That concentration risk on marketplace algorithms and promotional calendars is the fine print nobody reads.
4. Financials Overview
Figures are consolidated, in ₹ crore.
Metric
FY25 (Year)
FY26 (Latest Year)
YoY Change
Revenue
144.18
254.89
+76.8%
EBITDA
19.2
33.3
+72.7%
PAT
12.80
19.31
+50.9%
EPS (Annualised)
10.11
13.16
+30.2%
Q4 Specifics (Jan–Mar 2026):
Metric
Q4 FY26
Q4 FY25
YoY
Revenue
77.81
47.62
+63.4%
Operating Profit
11.03
6.61
+66.9%
PAT
6.02
4.16
+44.7%
EPS (Annualised Q4×4)
16.40
13.16
+24.6%
The profit story is real: PAT margins have climbed from 3% (FY24) to 7.6% (FY26). Operating margins (OPM) sit at 13.1%, up from 13.8% in FY25 — a slight compression, which management attributes to a shift in product mix (more wholesale, less direct retail).
Concall Substance (June 2026):
Management confirmed Q4 marked the “10th consecutive quarter of revenue growth.” The narrative is controlled: they’re scaling, profitability is improving, and new categories (womenswear, footwear) are “in early stages but encouraging.” However, they also admitted cash flow will stay negative “as long as growth stays above ROCE” and that near-term CFO positivity is “unlikely.”
That’s a red flag stated plainly.
5. Market Expectations & Historical Multiples
This section describes how the market is currently pricing the company and how that compares with its own history and peer group. It is descriptive, not predictive.
Metric
Current
Historical Average (5-yr)
Peer Median
P/E
21.4
27.3
22.2
EV/EBITDA
14.2
11.5
15.8
ROE
16.7%
18.5%
18.2%
ROCE
20.5%
18.2%
13.8%
The market pays 21.4x earnings here, which is below its own 5-year average of 27.3x but sits exactly at the peer median of 22x. The EV/EBITDA multiple (14.2x) is below peer median (15.8x) and below the 5-year average, suggesting modest valuations for the scale being achieved.
ROE at 16.7% lags the peer median (18.2%) and the company’s own 5-year average (18.5%). ROCE at 20.5% outpaces the peer set (13.8%), signaling capital-efficient operations relative to large-cap textile companies.
The market appears to be pricing in high growth (reflected in the 77% revenue CAGR) alongside near-term profitability limits — not yet repricing the business as a mature retailer with positive