General information and entertainment, not investment advice. The author is not a SEBI-registered adviser or research analyst. No recommendation, no promised returns. Markets carry risk including loss of capital. Figures may not be current. Consult a registered adviser before acting.
1. At a Glance
The company turned over ₹1,315 crore in FY26—a 5% climb from the prior year, but landing on a profit margin of 1.8%, the lowest in a five-year window. Operating leverage compressed: the margin on operations dropped to 1.8% from 1.4% the year before, then again collapsed to near-zero in Q4 alone. The balance sheet carries ₹673 crore in net worth, zero debt, and ₹283 crore in unencumbered liquid assets (including ₹257 crore in mutual fund holdings). The cash pile is fat, the profitability is thin. A division sits within the Hero Group.
At ₹127.74 per share (lagged reference), the stock trades at 21.9x annualised earnings—a narrow discount to the peer median of 27.6x, yet above its own five-year average of 19.2x. The tension: a fortress balance sheet meets a straitened operating model, and investors must decide whether the cash buys time for a turnaround or remains a liability of indecision.
2. Introduction
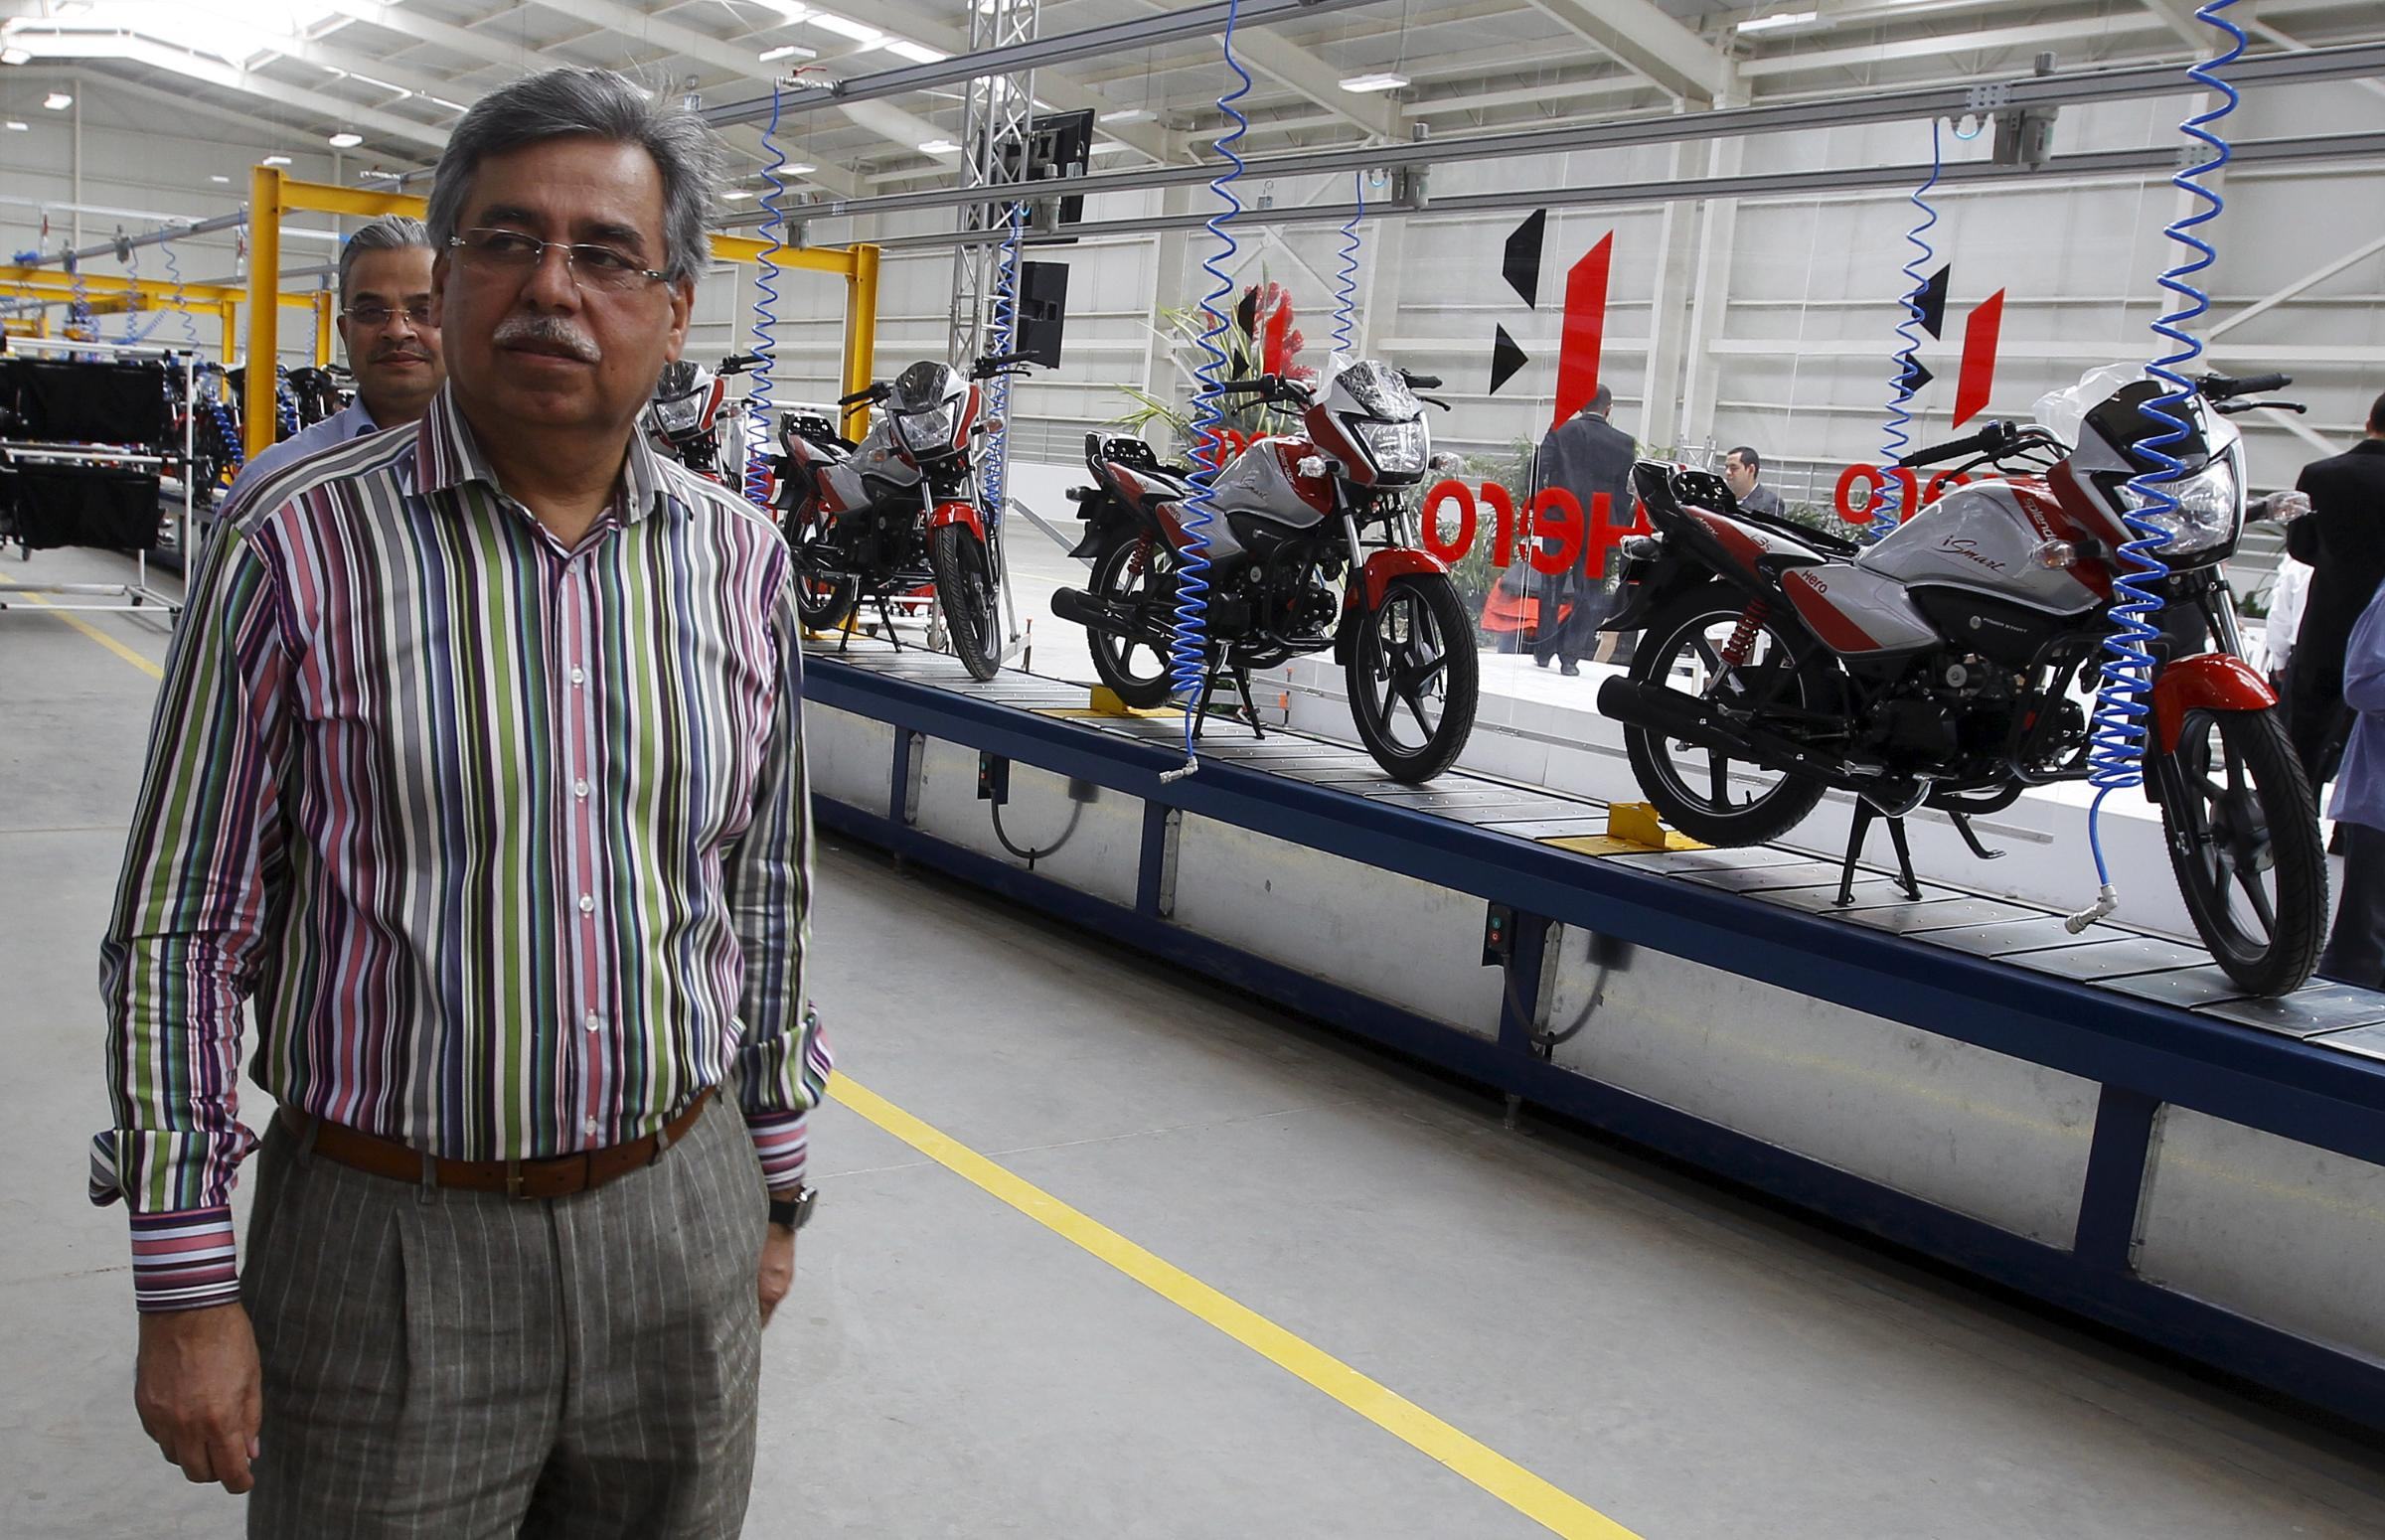
Munjal Showa manufactures shock absorbers and other suspension components for two-wheeler and four-wheeler original equipment manufacturers (OEMs). The company was set up in 1985 in technical and financial collaboration with Showa Corporation of Japan; in June 2010, the Munjal family restructured its holdings, leaving Yogesh Chander Munjal (the founder’s son) as the controlling shareholder through Dayanand Munjal Investments Pvt Ltd. In December 2024, Hitachi Astemo Ltd (formerly Showa Corporation’s successor) held 24.9% of the company.
Recent months have brought regulatory friction. In December 2025, the company received a ₹703.83 lakh income-tax demand for assessment year 2022–23 (under appeal) and a ₹33.28 lakh GST demand for FY 2021–22 (under appeal). In October 2024, a tax demand of ₹9.7 crore surfaced; in July 2024, a ₹14.8 crore demand was received. A company secretary resignation in August 2025 marked an internal shift. On 29 August 2025, CRISIL downgraded the long-term credit rating from A/Stable to A−/Stable and withdrew the commercial paper rating, citing “sustained moderation in the business risk profile” and “lower-than-expected profitability.” The credit rating memo noted that capacity utilisation sits at 50–60%, margin correction measures (VRS, solar power plant installation, revised standard operating procedures) are in motion, and the company expects operating margins of 1.8–2.1% in the medium term.
The most recent quarterly result (Q4 FY26) showed a net loss of ₹0.05 crore and near-zero operating profit of ₹0.02 crore on ₹347 crore sales. Management attributed the shortfall to labour code implementation (a ₹220 crore gratuity liability charge was taken as an exceptional item in FY26) and volume declines from key customers.
3. Business Model: WTF Do They Even Do?
Munjal Showa serves two narrowly defined buckets: the two-wheeler suspension (front forks, rear shock absorbers) and the four-wheeler struts/window balancer segment. The factory footprint is tight—three plants in Gurugram, Manesar (Haryana), and Haridwar (Uttarakhand), clustered near the OEMs they supply.
The customer list reads like a cartel: Hero MotoCorp alone accounted for 80–85% of revenue in recent periods. Honda Motorcycle and Scooters India was once a 20% revenue bucket (as of FY13) but exited the relationship when Showa India Pvt Ltd (a 100% Hitachi Astemo subsidiary) replaced Munjal Showa as the primary shock-absorber supplier. Maruti Suzuki India now supplies struts and window balancers, but the hero worship never stopped. The model is a supplier’s nightmare: a single customer with pricing power, low barriers to exit, and no product differentiation. Capacity utilisation runs at 50–60%, a signal that the company is built for demand it no longer captures.
The two-wheeler market itself has fractured. Hero MotoCorp’s overall vehicle sales have stalled; the electric two-wheeler segment is fragmenting across Hero Electric, Revolt, Okaya, BattRE, and others, each with different suspension architectures. Munjal Showa supplies some of these EV platforms, but the volume game is no longer Hero’s exclusive fiefdom. The company has no direct presence in the high-margin aftermarket. Exports are hobbled by contractual restrictions from Hitachi Astemo. The product mix is static, the customer concentration is choking, and the margin is gasping. This is not a business model—it is a legacy supply arrangement waiting for a restructuring.
4. Financials Overview
Figures are consolidated, in ₹ crore.
Metric
FY26
FY25
FY24
YoY (FY26 vs FY25)
Revenue
1,315
1,250
1,173
+5.2%
EBITDA
34
29
28
+17.2%
PAT
22
29
31
−24.1%
EPS (annualised)
5.47
7.22
7.69
−24.2%
The top line grew 5% year-on-year, a plodding pace. EBITDA (Operating Profit + Depreciation) inched up 17%, but that was driven entirely by lower depreciation and exceptional items—the underlying operational engine is sick. Net profit fell 24% to ₹22 crore, the lowest in three years. The Q4 print was damning: a net loss of ₹0.05 crore on sales of ₹347 crore, implying an operating margin of −0.01%.
The company attributed Q4 weakness to:
A ₹220 crore labour code charge (gratuity liability adjustment for the new consolidated wage codes, treated as an exceptional item).
A ₹322 crore separation cost for voluntary retirement scheme (VRS) placements.
Steep volume declines from Hero MotoCorp, with Q1 FY27 (June quarter) sales already down 8% year-on-year and the operating margin collapsed to 0.5%.
The annual dividend was recommended at 225%, or ₹4.50 per share (on a ₹2 face value), paid from cash on hand—a testament to the balance sheet’s strength and the board’s unwillingness to cut returns despite the profitability cliff.
5. Market Expectations & Historical Multiples
This section describes how the market is currently pricing the company and how that compares with its own history and peer group. It is descriptive, not predictive.
Metric
Current
5-Year Average
Peer Median
P/E Ratio
21.9x
19.2x
27.6x
EV / EBITDA
12.1x
—
—
ROE
3.48%
2.63%
13.5%
ROCE
4.72%
—
15.88%
The market pays 21.9 times earnings for Munjal Showa, against a peer band ranging from 21.9x (at the low end, for Sona BLW Precision, which earns 12x return on equity) to 92x (Tube Investments, with a 9.9% ROE). The peer median sits at 27.6x, and MSL trades comfortably below it—a rare discount for a company with comparable scale (₹515 Cr market cap vs. peer median of