Elgi Equipments FY26: The Tariff, the Margin, and the Low-Cost Monster at the Gate
General information and entertainment, not investment advice. The author is not a SEBI-registered adviser or research analyst. No recommendation, no promised returns. Markets carry risk including loss of capital. Figures may not be current. Consult a registered adviser before acting.
1. At a Glance
Elgi Equipments delivered 12.7% consolidated revenue growth to ₹3,951 Cr in FY26, with a PAT of ₹430 Cr—27% above the prior year. Underneath sits a story of cost inflation, tariff volatility, and management’s scramble to reprice before commodities run away again.
The operating margin held at 15% (₹579 Cr EBITDA) but management acknowledged it “should have been” about 14% higher before tariff drag and a 16% spike in employee costs. Cash conversion remained robust at 100% of EBITDA, and net cash stayed “pretty solid.”
Three material tensions loom: Europe went loss-making in FY26 but hit breakeven in Q4, signalling a turnaround or a wobble. Chinese low-cost competitors are now proliferating across every geography, and Elgi is rushing a new budget product line to India by September 2026. Q1 FY27 margin guidance is “roughly same,” but June will be the acid test—management is repricing to absorb commodity inflation already frontloaded into the quarter.
2. Introduction
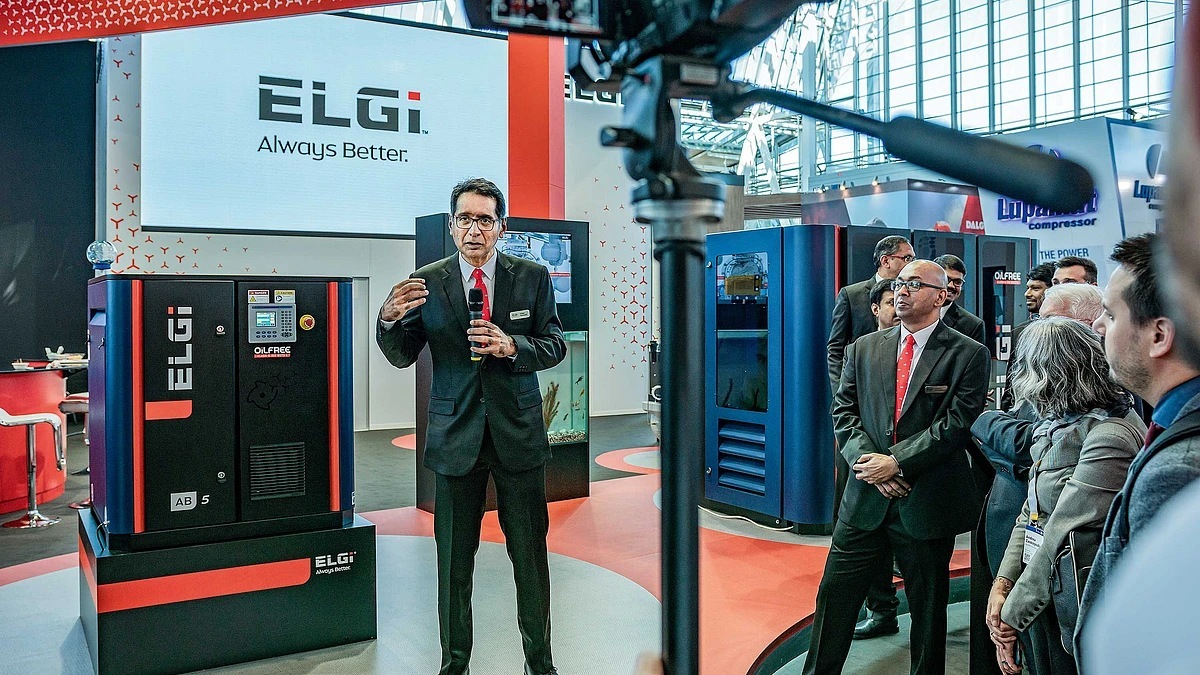
Elgi Equipments, incorporated in 1960, is the second-largest air compressor manufacturer in India and the sixth globally. The company operates as a diversified industrial equipment maker across compressors (92% of sales), automotive aftermarket (ATS Elgi), and a growing vacuum business still in incubation.
FY26 was marked by three intersecting dynamics. First, the domestic market held steady with “strong inquiries across all business verticals,” though management flagged elongated sales conversion cycles as a caution signal. Second, overseas markets—particularly North America and West Asia—showed tentative recovery, though Europe remained under pressure until Q4. Third, US tariffs shifted from chaos (50% rates with inventory confusion) to a “settled down” 25% regime, though tariff refunds remain in negotiation.
The year was also structural: management reorganized shared services, consolidating US and European processes into India-based operations, which spiked employee costs by 16% YoY. Management framed this as investment, not inefficiency. A ₹78 Cr capex run (of a ₹250 Cr announced cycle for FY25) went toward the MK2 project—shifting assembly and motor plants to a single 250-acre facility to cut costs and improve control.
3. Business Model: WTF Do They Even Do?
Elgi makes three broad buckets of compressors: oil-lubricated screw, oil-free screw, and reciprocating piston—the latter favored for portability. The automotive segment (ATS Elgi) adds garage equipment and jacks. A medical/vacuum line exists but is nascent (licensed from DVP, Italy, for a “10-to-12-year incubation program”).
Compressor demand is broad-utility: food processing, pharma, foundries, forging, general engineering, steel mills, mining, construction, FMCG. Management resists over-indexing to any single vertical because the tail is long and lumpy. Railways get special attention—Elgi dominates inter-city rail but has not cracked metros (dominated by global OEM tenders with locked vendor ecosystems and long qualification timelines). Defence is de-facto absent; a high-pressure submarine compressor on INS Vikrant exists via a minority JV, but management calls defence cyclical and misaligned with focus.
Geography is the real story. Domestic revenue (~47% of FY26 consolidated sales) is growing steadily; overseas is ~53% and split roughly equally between established markets (North America, Europe) and emerging (Middle East, Southeast Asia, Australia). This distribution diversification is intentional—it flattens demand volatility from any single end-market cycle.
The company owns 26 subsidiaries and nine JVs outright. Material subsidiaries include Elgi Compressors USA Inc, Rotair SPA (Italy—acquired 2012), Pattons Inc (USA—acquired 2012), and Michigan Air Solutions (USA—acquired FY20). ATS Elgi Ltd handles automotive. A captive foundry feeds parts, and motor manufacturing is now ~95% in-house (target 100% by Sep 2025).
4. Financials Overview
Figures are consolidated, in ₹ crore.
Metric
FY26
FY25
YoY Change
Revenue
3,951
3,510
+12.5%
EBITDA
579
529
+9.4%
PAT
430
350
+22.9%
EPS (₹)
13.57
11.05
+22.8%
Quarterly Trajectory (Q4 vs Prior Quarter):
Metric
Q4 FY26
Q3 FY26
QoQ
Revenue
1,113
968
+14.9%
Operating Profit
173
140
+23.6%
PAT
128
121
+5.8%
EPS
4.04
3.83
+5.5%
Revenue growth of 12.5% masked uneven geography: domestic +12% on steady demand, overseas mixed (North America “exceedingly well” in industrial and portables; Europe a drag; Australia weak; West Asia cautious due to “uncertainty”). Margin at 15% OPM was historically normal but management’s commentary revealed the arithmetic underneath.
Q4 PAT at ₹128 Cr was strong, but full-year PAT of ₹430 Cr reflected one-time adjustments: a wage code provision booked in Q3 and higher depreciation from lease accounting post-property sale and re-lease.
From the Concall (May 29, 2026):
Management stated EBITDA “should have been about 2,100 odd million” (vs ₹1,891 Cr actual across FY26) absent three drags: tariff impact (described as “marginal and timing-driven”), employee cost hikes (+16% linked to shared services centralization), and other expense growth (+8% from PLM/IT initiatives). Management flagged that removing tariff effects, EBITDA erosion from commodity volatility, and structural cost investments would move the needle materially in H1 FY27, where repricing actions initiated in Feb–Mar are already embedded in Q1 pricing.
5. Valuation Discussion: Fair Value Range (Educational Only)
What follows is a walkthrough of how three valuation methods work, using this company’s numbers as the example—not a target, not a forecast, not advice.
Reported EPS Baseline: FY26 reported EPS = ₹13.57. Management also cites “underlying” EBITDA closer to ₹535–540 Cr (normalizing for tariffs and one-offs). Using annualised FY26 reported EPS of ₹13.57 as the denominator:
Method 1 (P/E): Annualised EPS ₹13.57 × peer band P/E of 41–51x produces ₹556–692 per share.
Method 2 (EV/EBITDA): FY26 EBITDA ₹579 Cr × peer band EV/EBITDA of 24–28x produces ₹13,900–16,212 Cr enterprise value; subtracting estimated net debt of ₹(274) Cr (net cash position) and dividing by 31.7 Cr shares yields ₹439–510 per share.
Method 3 (Simplified DCF): Assuming mid-cycle EBITDA of ₹600