Oriental Rail: Execution Delays, Margin Recovery—And a ₹1,740 Cr Orderbook That Pretends the Revenue Didn’t Fall
General information and entertainment, not investment advice. The author is not a SEBI-registered adviser or research analyst. No recommendation, no promised returns. Markets carry risk including loss of capital. Figures may not be current. Consult a registered adviser before acting.
FY26 told two contradictory stories: revenue collapsed 4.8% to ₹573 Cr, strangled by wheel shortages, labour crises, and dispatch delays. Yet the company wrung a 325 basis-point margin expansion from the wreckage—EBITDA margin jumped to 14.9% from 11.6%—and PAT climbed 44.6% to ₹42.2 Cr.
The orderbook swelled to ₹1,740 Cr (3.3x annual revenue), a fortress of visibility that dwarfs the near-term operational stumbles.
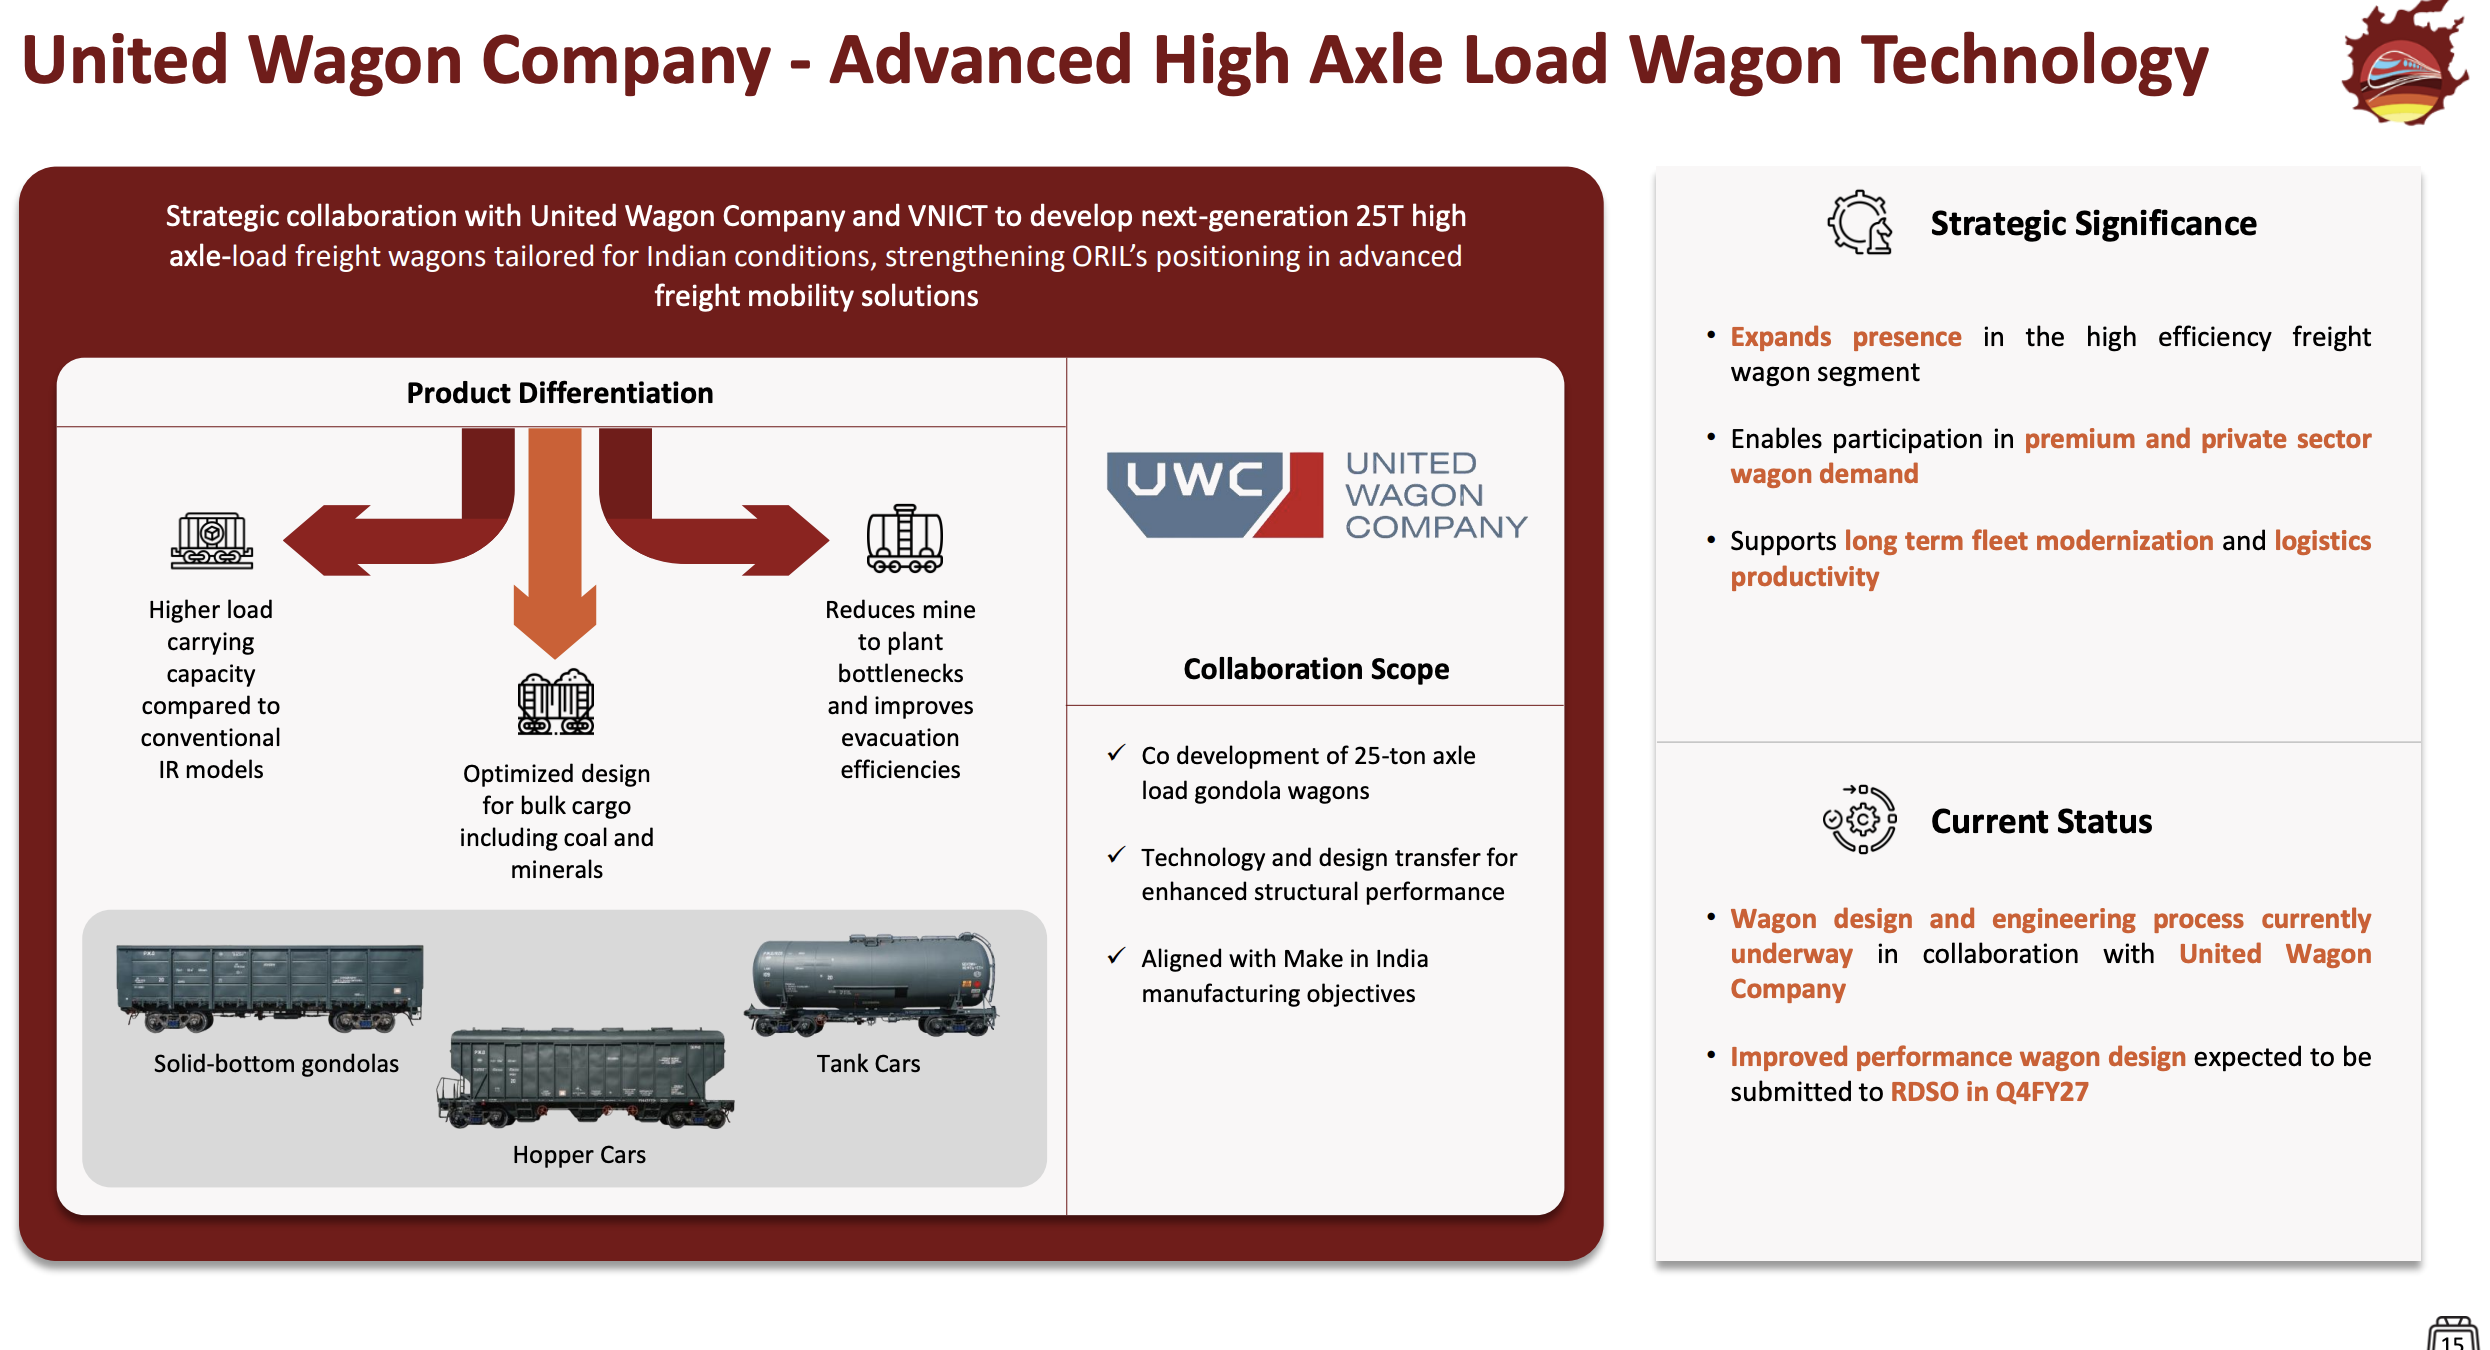
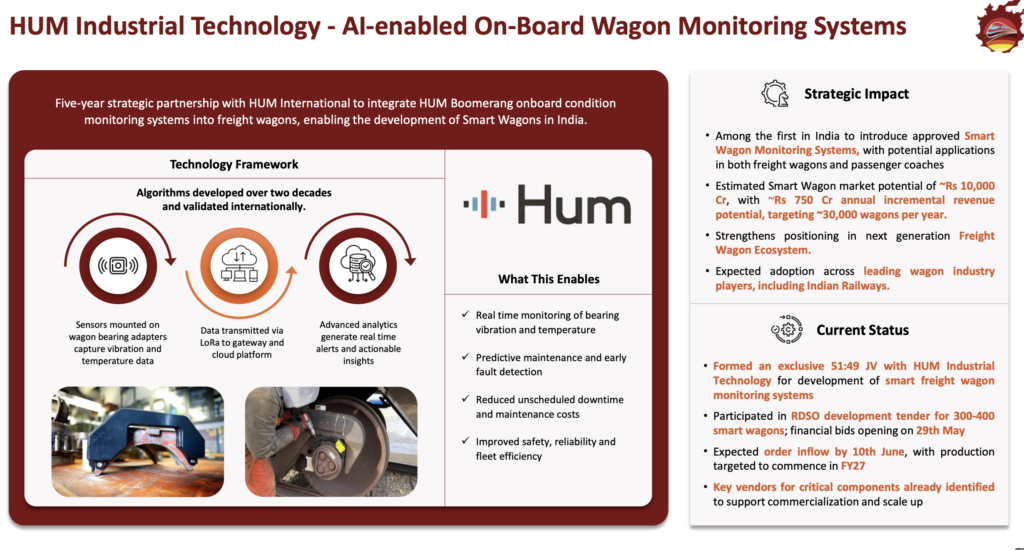
Three moves draw attention: a strategic partnership with HUM International (USA) to deploy smart wagon monitors, a co-development play with United Wagon (Russia) on next-gen high-axle-load platforms, and fresh approvals to enter the wagon-leasing business—a recurring-revenue lane that doesn’t yet exist in the financials.
The real tension: margins improved despite headwinds. Capacity is only half-utilised. And the company is betting hard on orders that haven’t yet arrived.
Price reference: ₹140 (as of 5 Jun 2026). Figures are consolidated, in ₹ crore.
2. Introduction
Oriental Rail (ORIL) was born in 1991, spinning out of the Mithiborwala family’s commodity trading roots into railway component manufacturing. Three decades later, it supplies Indian Railways with integrated passenger interiors (seats, berths, artificial leather) and, through its 2014-acquired subsidiary Oriental Foundry (OFPL), freight wagons and the critical subcomponents (bogies, couplers, springs, draft gears) that hold them together.
The company operates across four manufacturing footprints: a 40-acre base in Thane (Maharashtra) for seats and rexine, two Gujarat units for wagons and bogies. Capacity: 3,600 coach sets p.a., 2,400 wagons p.a., 36 lakh meters of artificial leather p.a.
For decades, the passenger interior business was the bread-and-butter—margins stable, volume locked, RDSO approvals rock-solid, market share approaching 30%. Then FY19 pivoted the boat: freight wagons arrived. The wagon order book now dwarfs passenger interiors. FY26 revenue mix: wagons 70%, seats & berths 23%, rexine 4%, others 3%.
The challenge that FY26 exposed: growth in wagons turned out to be operationally messier than forecast. Wheel supply snapped mid-year. Labour shortages in Gujarat rippled through production. Delivery timings slipped. Gas prices spiked. The company still hit margin targets—a mark of cost discipline—but revenue took a step backward.
3. Business Model: WTF Do They Even Do?
Strip it to the metal: ORIL manufactures two product families for a single customer type—Indian Railways.
Passenger Interiors (ORIL standalone). Seats. Berths. Compreg boards (compressed wood used in flooring and panels). Rexine—proprietary artificial leather branded ORVIN, backward-integrated in-house, sold to railways and spun out to automotive, footwear, and luggage makers. The segment hums on volume, repeat orders, RDSO and RITES approvals, a ~30% grip on the organised seats market, and the fact that every new train needs these parts. Margin band: 13–15% EBITDA.
Freight Wagons & Components (OFPL subsidiary). The growth child. ORIL designs and manufactures integrated freight wagons—high-capacity, flat-bottomed, gondola, hopper cars, tank cars—with fully in-house bogies, couplers, draft gears, bogie springs, and side bearers. This vertical integration matters: it locks in margin, kills supply risk, and lets the company tune designs for Indian Railways’ quirks. Installed capacity: 2,400 wagons p.a. at 50% utilization (headroom to 4,000 with capex). Margin band: 15–17% EBITDA.
The business model is textbook tender-driven. Indian Railways publishes demands. Companies bid. The low-cost vendor often wins (or second-lowest). Delivery timelines are tight, payment lags, and raw material swings (timber, steel, wheels) eat margin unless clauses lock in price variation. For wagons, ORIL now bids with steel and wheel hedges baked in, a hard-won lesson.
Recurring revenue? Enter the leasing play. The company received regulatory approval on 1 Jan 2026 to establish a Wagon Leasing Company subsidiary. Two tenders already bid. The idea: manufacture wagons, retain them on the balance sheet, lease them to private freight operators and corridor operators, pocket multi-year rental streams. This is not in FY26 numbers yet, but the machinery is live.
4. Financials Overview
Figures are consolidated, in ₹ crore.
Metric
FY26
FY25
YoY Change
Revenue
573.35
602.22
-4.8%
EBITDA
85.43
70.06
+21.8%
EBITDA Margin
14.9%
11.6%
+325 bps
PAT
42.24
29.22
+44.6%
PAT Margin
7.4%
4.9%
+252 bps
EPS (annualised)
6.30
4.53
+39.1%
Q4 FY26 Performance. Revenue grew 9.5% YoY to ₹153.5 Cr. EBITDA margin expanded 295 bps to 15.4%. PAT surged 121% to ₹11.9 Cr (₹1.77 per share annualised). The quarter was cleaner than the year—wheel supply stabilised, labour eased, mix improved. Management commentary noted “stronger operational efficiencies and increased in-house manufacturing of components that were previously outsourced.”
FY25 Comparison. Revenue was ₹602 Cr (12.6% growth over FY24). EBITDA margin was 11.6%, crimped by raw material costs and higher professional fees tied to HUM International and United Wagon development contracts. PAT margin dipped to 4.9%.
Working Capital Severity. The balance sheet shows the crux of ORIL’s operating model: high inventory (₹297 Cr), stretched receivables (₹186 Cr, 119 debtor days vs. 87 days a year earlier). The cash conversion cycle lengthened to 334 days in FY26 from 266 days in FY25. Wagons sit in inventory post-manufacture, pending inspection and dispatch on IR’s timelines. Receivables age because IR payment cycles are glacial by corporate standards. This working capital stretch forced reliance on short-term borrowings (₹284 Cr in FY26 vs. ₹203 Cr in FY25), eating into cash and interest cover.
Operating cash flow was negative: -₹29.7 Cr in FY26. This is not a failure signal in a working-capital-intensive business; it’s structural. But it means the company must fund growth through borrowings or equity, not cashflow. The promoters infused ₹31.5 Cr as quasi-equity (interest-free loans) in FY25, and raised ₹212 Cr via preferential equity issuance in Q4 FY24 (received by July 2025). This kept the balance sheet stable.
5. Valuation Discussion: Fair Value Range (Educational Only)
What follows is a walkthrough of how three valuation methods work, using this company’s numbers as the example—not a target, not a forecast, not advice.
Method 1: P/E Multiple. Annualised EPS (FY26 full-year basis) is ₹6.30. The peer band for industrial products and capital goods sits at 23–30x. Applying this band to the company’s earnings:
₹6.30 × 23x to 30x produces ₹145 to ₹189 per share.
Method 2: EV/EBITDA Multiple. EBITDA (FY26) is ₹85.4 Cr. Net debt is ₹220 Cr (borrowings ₹305 Cr minus cash ₹85 Cr).