FlySBS Aviation Mar 2026: 114% Profit Growth and an 11.6x P/E, But Who Owns the Planes?
Date of Publishing -
Spotted a factual error — a wrong number, date, or fact? Tell us and we will check the source.
Section 1 — At a Glance
FlySBS Aviation Ltd closed FY26 with a spectacular set of numbers that demand immediate attention. Revenue more than doubled over two years, scaling from ₹106.49 Cr in FY24 to ₹318.53 Cr. The bottom line was even more aggressive, with Net Profit surging 114% to hit ₹60.77 Cr. This operational leverage drove the Return on Capital Employed (ROCE) to an exceptional 32.5%.
On paper, this is the kind of aggressive growth trajectory that typically commands a premium multiple. Yet, the market is currently assigning the stock a muted P/E of just 11.6x. This discrepancy is the core puzzle of FlySBS.
While the headline growth is undeniably robust, secondary signals warrant scrutiny. The promoter holding sits at a conspicuously low 32.47%, leaving nearly 65% of the company in the hands of the public—a highly unusual structure for a newly minted SME player. Furthermore, an independent monitoring report has flagged ₹12.35 Cr in unutilised IPO proceeds. Earnings growth buys attention, but holding structures dictate who actually profits. The tension between FlySBS’s elite clientele and its retail-heavy cap table makes this a fascinating, high-stakes setup.
Section 2 — Introduction
Incorporated in 2020, FlySBS Aviation operates out of Chennai with a DGCA-approved permit to fly people whose hourly billing rates exceed most people’s annual salaries. They are a non-scheduled operator (NSOP) in the private jet charter space.
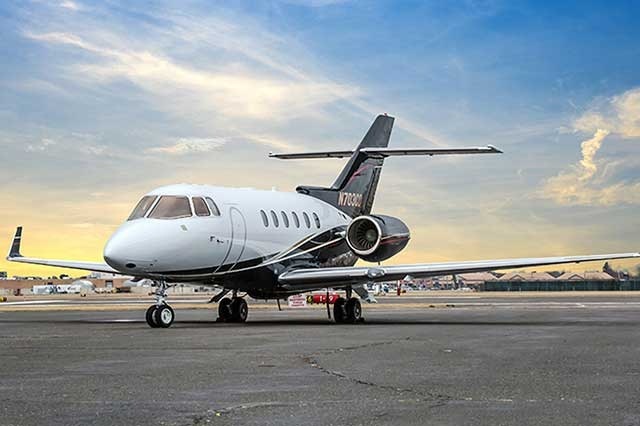
Historically, the company operated primarily on wet leases—essentially renting both the plane and the crew. Recently, they’ve pivoted to a dry lease model (renting just the aircraft and using their own crew), anchored by a 13-seater Embraer Legacy 600. It is a classic margin-expansion play: take on more operational headache in exchange for keeping a larger slice of the billionaire’s charter fee.
Section 3 — Business Model: WTF Do They Even Do?
They fly VIPs. Specifically, they offer “flexible scheduling,” which is the aviation industry’s mock-formal phrasing for “we will hold the plane on the tarmac until the client finishes their breakfast.”
FlySBS serves politicians, diplomats, corporate executives, and ultra-high-net-worth individuals (UHNIs). Interestingly, nearly 94.5% of their FY25 revenue came from corporate clients rather than individual UHNIs. They aren’t just flying people to Goa for the weekend; they are running routes to Japan, New Zealand, the Middle East, and Mauritania.
In FY25, international travel accounted for ~77% of their revenue. They are effectively an airborne limousine service for global boardrooms, transitioning to a dry-lease fleet to capture better unit economics.
Section 4 — Financials Overview
Figures are consolidated, in ₹ crore.
Metric
Latest Half (Mar 2026)
YoY (Same Half)
Previous Half
Revenue
181.00
110.00
138.00
Operating Profit
38.00
32.00
31.00
PAT
37.00
23.00
24.00
The second half of FY26 was a blockbuster. Topline jumped 64.5% year-on-year to hit ₹181 Cr, while Operating Profit expanded to ₹38 Cr. When half-yearly top-line jumps 64%, the business is either capturing secular tailwinds or pulling forward future demand. Management noted in their investor presentation that “the company plans fleet expansion through dry lease, improving cost control and operational flexibility.” The translation? They are tired of sharing margins with global lessors and want to control the metal. The H2 numbers suggest the pivot is bearing fruit, but keeping planes in the air is notoriously capital-intensive.
Does a pivot to dry leasing actually fix the cyclicality of aviation, or just increase the fixed costs when the music stops?
Section 5 — Valuation Discussion: Fair Value Range Only
With an FY26 EPS of ₹35.13 and a current market price of ₹408.5, FlySBS is trading at a P/E of 11.6x. For context, aviation peers like TAAL Tech trade at roughly 18.9x, while the broader industry median hovers around 15.3x.