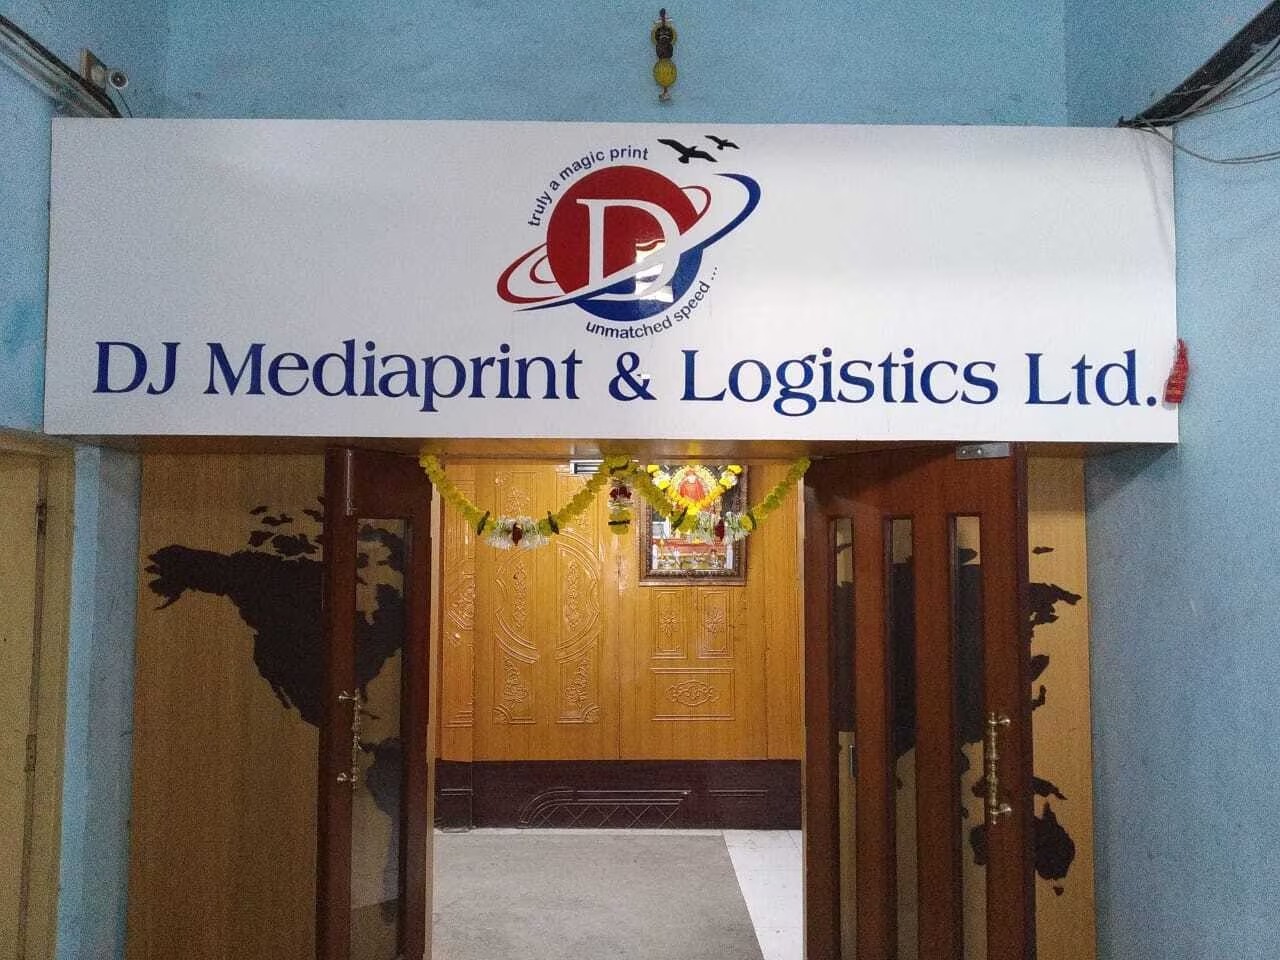
DJ Mediaprint FY26: The ₹51 Crore Receivable Riddle
Section 1 — At a Glance
The financial year 2026 has delivered a massive divergence between accounting profits and real cash flows for DJ Mediaprint & Logistics Ltd. On paper, the headline growth trajectory remains remarkably robust. Standalone revenue scaled from ₹78.07 crore in FY25 to ₹116.36 crore in FY26, marking an impressive 49% expansion. Net profit matched this operational velocity, jumping 53% to hit ₹10.04 crore, up from ₹6.55 crore in the preceding year.
Yet, beneath this pristine surface of double-digit profit growth lies a severe capital efficiency crunch. While the profit and loss statement records record-shattering performance, the balance sheet tells a far more restrictive story. Trade receivables nearly doubled over the past twelve months, skyrocketing from ₹25.66 crore to ₹51.09 crore. This means that nearly half of the entire revenue generated throughout the year remains uncollected, locked up on the ledgers of corporate and government counterparties.
The consequences of this accumulation are starkly visible in the cash flow statement. Cash generated from operating activities plunged deep into negative territory, dropping to negative ₹17.42 crore. True corporate health cannot be measured by paper earnings alone; when working capital cycles stretch excessively, accounting profits turn into phantom liquidity. With debtor days swelling to 160 days and an inventory expansion to ₹26.73 crore, the market is left evaluating whether this is an agile logistics specialist scaling up or an over-extended printer financing its own growth.
Section 2 — Introduction
DJ Mediaprint & Logistics Ltd. occupies a distinct, hyper-fragmented niche in the domestic corporate services landscape. Originally set up in 1999 as a proprietary venture and corporate-formed in 2009, the business has historically attempted to bridge the gap between heavy security printing, digital data handling, and bulk physical distribution.
The company’s strategic roadmap in recent quarters highlights an aggressive push for geographical and operational scale. Over the past couple of years, management has rapidly expanded its footprint, opening an international outpost in Guangzhou, China, and growing its total secure storage infrastructure to a massive 400,000 square feet. This expansion marks a concerted effort to shift away from old-school, commoditised commercial paper printing toward stickier, long-term contractual arrangements like systemic corporate record management. However, physical infrastructure commands upfront maintenance, and as the asset base spreads across new geographies, the financial operations are facing localized friction.
Section 3 — Business Model: WTF Do They Even Do?
To the uninitiated, DJ Mediaprint’s corporate slide deck reads like a chaotic shopping list of B2B chores. They will write your corporate content, design your annual reports, print your secure MICR cheque books, scan your historical registries, store your physical files across 400,000 square feet of warehouses, supply valet drivers to your corporate office, and drop your bulk legal notices directly to India Post.
Stripping away the corporate jargon, the core business splits cleanly into two primary units: Printing (which drives 66.7% of the top line) and Services (which contributes the remaining 33.3%). In essence, they act as the ultimate administrative back-office utility for highly bureaucratised industries like banking, insurance, and government departments. If a large public sector bank needs to print millions of secured forms and archive decades of physical account registries, DJ Mediaprint steps in. It is a sticky operational model because migrating millions of legacy files to a competitor is an absolute operational nightmare—but it also binds the company’s cash collection cycles tightly to the notoriously slow payment processing rooms of large institutional clients.
Section 4 — Financials Overview
Figures are consolidated, in ₹ crore.
Quarterly Performance Trend
Metric
Latest Quarter (Mar 2026)
YoY
QoQ
Revenue
₹46.42 cr
67.9%
106.3%
EBITDA
₹9.91 cr
60.1%
133.2%
PAT
₹5.35 cr
78.9%
212.9%
EPS
₹1.56
69.6%
212.0%
The final quarter of FY26 witnessed an absolute explosion in headline activity. Revenue for the quarter came in at ₹46.42 crore, nearly matching what the company used to generate in an entire year at the start of the decade. EBITDA margins hovered comfortably at 21.35%, leading to a stellar quarterly net profit of ₹5.35 crore. Sudden spikes in final-quarter billings frequently point to aggressive volume clearing before fiscal year-ends, which directly explains why cash