Epack Durable Q4 FY26: The 692x P/E Appliance Maker in Need of a Cold Shower
Section 1 — At a Glance
A multi-year capital investment program colliding with a brutal cyclical downturn has left consumer electronics manufacturing standout Epack Durable facing a punishing profitability crunch. Headline metrics for the full financial year 2025-26 reveal structural vulnerability behind the company’s aggressive manufacturing buildup. Annual revenue from operations contracted 12.7% year-over-year to ₹1,894 crore, while intense promotional discounting and elevated fixed overheads compressed operating earnings. Net profit collapsed by 94.0%, dropping from ₹55.10 crore in the prior year to a skeletal ₹3.26 crore.
This bottom-line destruction has fundamentally detached the company’s capital market positioning from its underlying economic performance, leaving the stock trading at a dizzying price-to-earnings multiple of 692. Growth assets face a critical double-edged sword when massive capital expenditure runs directly into macro headwinds. For Epack, a ₹297 crore capital injection across its industrial footprints has temporarily inflated the asset base while operating capacities sit largely underutilized. Compounding this operating stress is a severe working capital extension, marked by a balance sheet holding ₹836.6 crore in inventory alongside mounting legal disputes over delinquent trade receivables. While management anchors its turnaround narrative on a rapid post-season operational recovery, near-term capital efficiency metrics tell a significantly more sobering story.
Section 2 — Introduction
Epack Durable Limited is an industrial design and assembly enterprise operating within India’s volatile outsourcing ecosystem. Having built its initial foundation in contract electronics assembly over two decades ago, the corporate vehicle shifted its strategic architecture in 2012 toward an Original Design Manufacturer model. This shift allowed it to transition from a simple toll-manufacturer to a designer of cooling appliances and domestic white goods.
The company presently manages a multi-location manufacturing footprint across five primary production complexes. Strategic asset deployment has recently centered on establishing dedicated, localized capacity expansion to capture manufacturing supply agreements with multi-national white goods brands. However, aggressive localization plans are now facing the harsh reality of severe seasonal market corrections.
Section 3 — Business Model: WTF Do They Even Do?
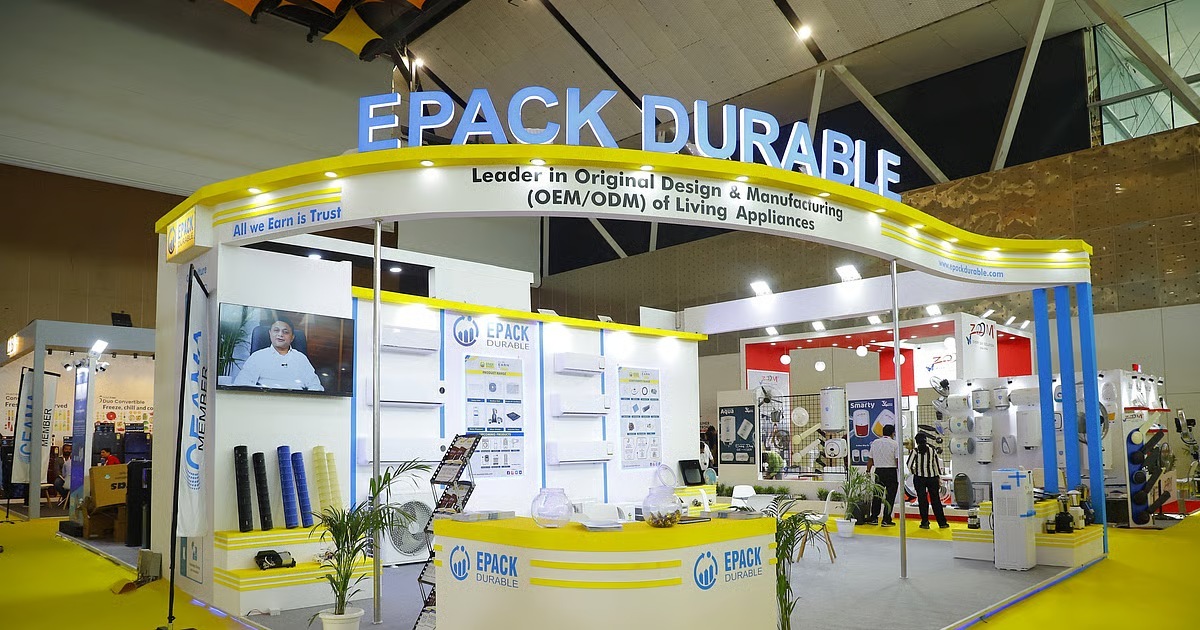
Epack is essentially the outsourced kitchen and garage behind some of India’s most visible appliance brands, working as the silent, invisible engineering muscle for labels like Voltas, Daikin, Carrier, and Blue Star. When a consumer buys a room air conditioner or a touch-button washing machine, there is a very high probability it was stamped out, wired, and packed by Epack.
The operational engine is divided into three distinct buckets of varying strategic stability:
Room Air Conditioners (RAC): The historical heavyweight, contributing 55% of FY26 revenue, down from a dominant 72% in FY25. Epack possesses an indoor unit capacity of 1.60 million and outdoor unit capacity of 2.05 million.
Small & Living Domestic Appliances (SDA & LDA): The diversification sandbox, scaling to 21% of revenue. It builds induction cooktops, water dispensers, and has recently moved into consumer lifestyle gadgets like nutri-blenders, air fryers, and dry vacuum cleaners.
Components: The deep infrastructure play, accounting for 19% of the top-line, turning out heat exchangers, cross-flow fans, sheet metal assemblies, and printed circuit board assemblies (PCBAs).
The existential problem here is that Epack owns none of the customer-facing brand equity. It assumes the structural fixed costs and capacity utilization hazards, while premium global brands retain the pricing power.
Section 4 — Financials Overview
Figures are consolidated, in ₹ crore.
Headline Performance Metrics
Metric
Latest Quarter (Q4 FY26)
YoY
QoQ
Revenue
591.05
-8.12%
38.12%
EBITDA
25.80
-64.22%
-18.61%
PAT
0.02
-99.95%
-99.92%
EPS
0.003
-99.92%
-98.89%
Did Management Walk the Talk?
During the late-stage assessments of fiscal 2026, the executive team pitched a narrative of robust operating stability supported by state incentives. The reality delivered in the fourth quarter was an operational car wreck. Operating profit plunged over 64% as margins cratered by 684 basis points to 4.37%. Net profit hit an absolute near-break-even wall, printing at a microscopic ₹2.4 lakh.
The structural mismatch was laid bare by complex regulatory adjustments. Epack was forced to execute a stinging ₹32.42 crore reversal of previously accrued Production Linked Incentive (PLI) income because its actual sales volumes fell short of the aggressive growth thresholds set by authorities. Management called the decision “proactive.” Analysts would call it an inevitable accounting correction for counting chickens