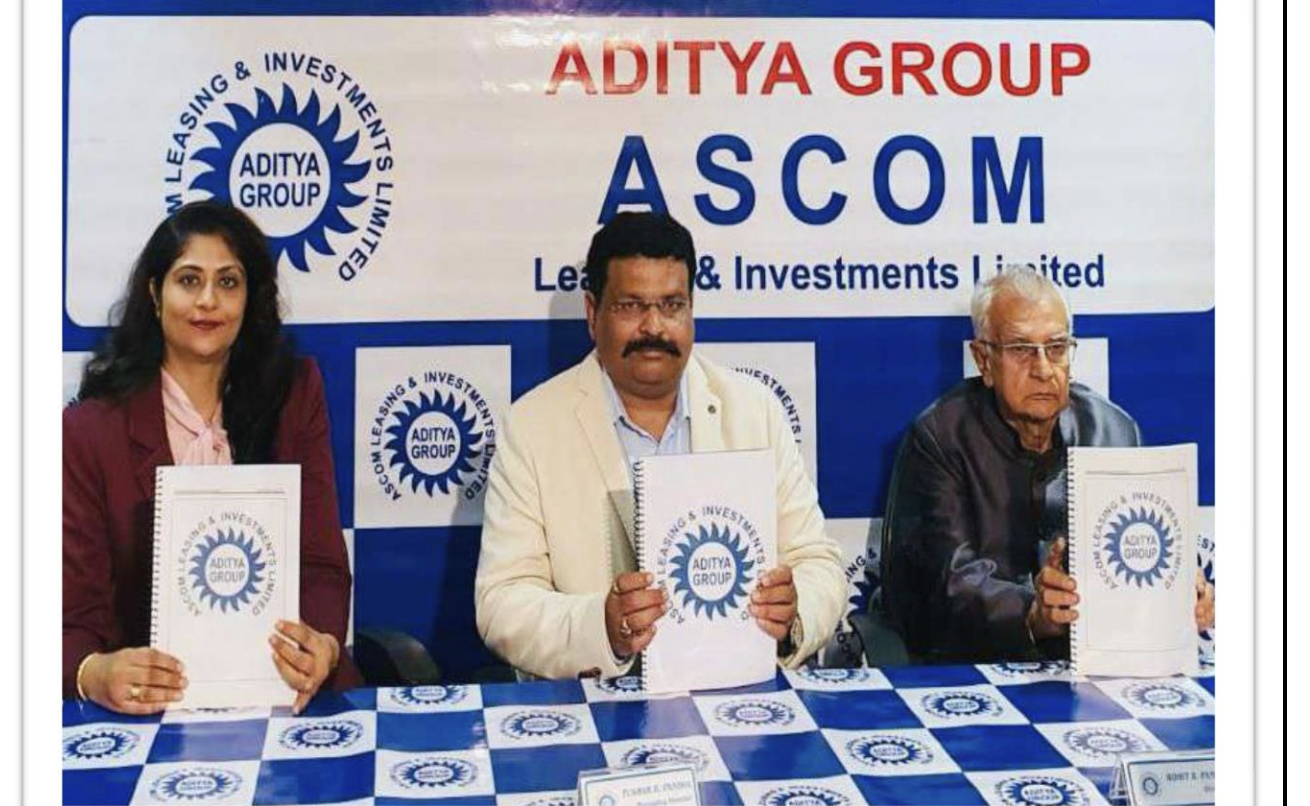
Ascom Leasing & Investments Limited FY26: A Multi-Year Flatline Placed on a 55x P/E Pedestal
Section 1 — At a Glance
A microcap financier operating far below the radar of major institutional investors presents an unusual paradox of extensive price appreciation alongside an almost completely frozen operational footprint. Heading into the close of the financial year ended March 31, 2026, the equity has experienced a staggering rise, posting a 209% return over the trailing twelve months. Yet beneath this market exuberance lies a financial engine running at a singular, unyielding pace. Total revenue has marginally drifted upward over a multi-year horizon, showing a prolonged consolidation that stands in sharp contrast to the momentum implied by its current market pricing.
The immediate hazard for an outside observer is the clear divergence between valuation multiples and underlying capital returns. A business that yields a modest return on equity cannot easily sustain premium pricing unless backed by exponential balance-sheet expansion or structural market dominance. Here, the micro-lending portfolio has largely remained range-bound, suggesting that the dramatic run-up in capital appreciation is entirely driven by multiple expansion rather than structural operational scale.
While the borrowing book has been prudently lightened—rendering the entity nearly free of conventional external leverage—the capital efficiency of the remaining assets continues to tick downward year after year. For those watching the ledger, the primary question shifts away from simple credit risk and focuses squarely on whether an operational engine growing at low single digits can ever structurally justify a valuation typically reserved for premium, high-growth financial disruptors.
Section 2 — Introduction
Ascom Leasing & Investments Limited entered the financial architecture back in 1986, setting up shop as a non-deposit-taking, non-systemically important Non-Banking Financial Company (NBFC). Operating primarily out of its base in Surat, Gujarat, the firm focuses on the granular edges of the retail credit market. Over the decades, it has kept its infrastructure incredibly lean, operating with a single-branch setup and a core roster of permanent staff that has barely fluctuated since the pre-pandemic era.
The corporate narrative over the last few years has shifted between absolute obscurity and a sudden burst of market interest. While the underlying business continues to issue small-ticket advances against property, vehicles, and gold, the equity has recently detached from its historical low-profile trading ranges. The business has reached a fork in the road: management has previously sought to engineer a migration from the SME platform to the main boards of the major exchanges, trying to introduce this quiet corner of Gujarati retail lending to a much wider tier of capital.
Section 3 — Business Model: WTF Do They Even Do?
To understand how this enterprise functions, one must imagine a financial intermediary that looks at the sprawling, aggressive world of digital consumer lending and decides instead to stick to classic, hyper-local asset collateralization. The operational menu is structured around retail and property-backed products:
Loan Against Property: Ranging from ₹5 Lakhs to ₹5 Crores, giving borrowers liquidity up to half the value of their brick-and-mortar real estate.
Pre-Owned Car Loans: Providing up to 80% financing on vehicles with repayment schedules spanning up to five years.
Gold Loans: Promoted as interest-free credit avenues, though the internal processing and collateral buffers ensure the house rarely loses.
The revenue mix makes no effort to hide its simplicity: approximately 99% of top-line inflows stem directly from financing activities, with the minor residual 1% sitting quietly in bank deposit interest. They run a single-branch operation. There are no complex cross-selling strategies, no wealth management arms, and no proprietary digital apps burning cash to acquire users. It is old-school asset backstopping, operating with a fixed overhead footprint that looks less like a modern financial factory and more like a private family office with a public ticker attached.
Section 4 — Financials Overview
Figures are standalone, in ₹ crore.
Because the company is listed on the SME platform and files its interim disclosures on a half-yearly basis, the financial trajectory is best captured by examining the six-month intervals.
Standalone Half-Yearly Financial Performance
Metric
Latest Half (Mar 2026)
YoY (Same Half Mar 2025)
Previous Half (Sep 2025)
Revenue
6.61
-3.36%
6.45
EBITDA / Operating Profit
3.78
-1.35%
3.95
PAT
2.58
2.79%
2.65
EPS (Reported)
2.20
2.33%
2.26
The top line during the latest six-month window contracted slightly compared to the identical period of the previous year, demonstrating that the lending pipeline is firmly hitting a structural ceiling. Operating profits mirrored this stagnation, down to ₹3.78 crore as the structural spreads within the loan book refuse to yield further efficiency. Reported net profit managed a tiny upward nudge to ₹2.58 crore, entirely supported by minor savings in finance costs as old loans were cleared off the balance sheet.
A core accounting reality of financial intermediaries is that net interest margins cannot expand indefinitely when the total gross loan portfolio remains static. Without balance sheet expansion, earnings quality inevitably flattens into a predictable baseline.