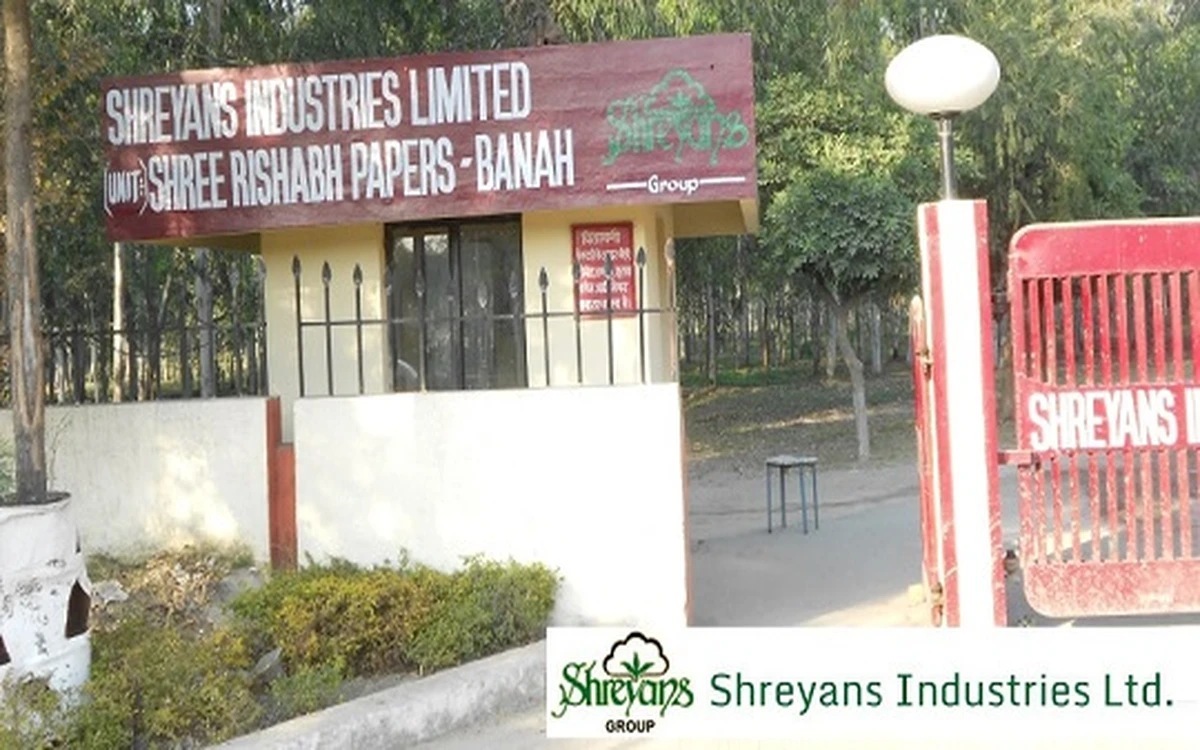
Shreyans Industries FY26: The ₹6 Crore Bottom Line Reality Check
Section 1 — At a Glance
Shreyans Industries Limited enters the close of FY26 facing a fundamental structural test as raw material inflation and global supply dynamics collide with domestic pricing caps. Headline sales remained essentially stagnant, crawling to ₹622.83 crore from ₹616.77 crore in FY25. However, the core operational performance tells a far more concerning story, with operating profit plunging from ₹70.16 crore to a sparse ₹15.89 crore.
The primary driver behind this stress is a dramatic escalation in raw material costs, which swelled from ₹266.33 crore to ₹305.67 crore over the fiscal year, alongside rising energy expenses. This rapid cost inflation completely overwhelmed the company’s pricing leverage, forcing net profit down to just ₹6.47 crore, a staggering collapse from the ₹50.60 crore recorded in the prior year.
Investor attention is increasingly focused on the sharp divergence between multi-year accounting returns and immediate cash metrics. While the balance sheet reflects a significant accumulation of investments totaling ₹214.08 crore, immediate cash generation has severely dried up. Operating cash flows fell to ₹14.46 crore in FY26 from ₹44.95 crore in FY25, highlighting an intensifying working capital crunch.
When an asset-heavy business loses its ability to pass on raw material price increases to the end consumer, accounting profits disappear long before physical production volumes show signs of distress.
The final quarter of the fiscal year further amplified these structural headwinds, culminating in a quarterly net loss of ₹10.48 crore. With an impending leadership transition in the finance function and ongoing regulatory scrutiny, the organization is now forced to balance defensive balance sheet preservation against a rapidly deteriorating operating environment.
Section 2 — Introduction
Welcome to the paper mill lottery, where your raw material arrives from a farmer’s field and your pricing power is dictated by a container ship from China. Shreyans Industries, a micro-cap component of the Oswal family’s corporate stable out of Ludhiana, has spent more than four decades turning agricultural residue into writing and printing paper.
Operating from its home turf in Punjab, the company has historically enjoyed a cozy proximity to its primary feedstock like wheat straw. But as FY26 painfully demonstrated, being close to the grass doesn’t save you when global commodity cycles decide to set fire to your margins. Management has historically glided through high-margin cycles by supplying textbook boards and private notebook manufacturers, but the latest financial year proved that when input costs spike, legacy distribution channels offer very little shelter.
Section 3 — Business Model: WTF Do They Even Do?
Shreyans Industries essentially runs a giant recycling and cooking operation. Instead of cutting down pristine forests, they gather agricultural leftovers—think wheat straw and sarkanda—and chemically treat them to create paper ranging from 44 GSM to 200 GSM. If you have ever flipped through a government school textbook, a railway ticket, or a standard postal envelope in India, there is a reasonable chance you have touched their portfolio.
Their revenue engine is split between selling actual paper (accounting for roughly 86%) and selling Soda Ash, a chemical byproduct recovered from their manufacturing waste, which brings in another 13%. They run two manufacturing units in Punjab with a combined capacity of approximately 94,000 metric tonnes per annum. They claim to export to places like the UAE and Nepal, but given that domestic sales make up the overwhelming majority of their footprint, their fortunes remain tethered to the pricing reality of the Indian market.
Section 4 — Financials Overview
Figures are standalone, in ₹ crore.
Metric
Latest Quarter (Mar 2026)
YoY
QoQ
Revenue
₹167.70 cr
0.11%
5.34%
EBITDA / Operating Profit
-₹10.94 cr
-163.42%
-179.80%
PAT
-₹10.48 cr
-170.34%
-310.98%
Reported EPS
-₹7.58
-170.32%
-311.96%
The quarterly trajectory shows an operation moving directly into