Healthcare Global Enterprises Mar 2026: The ₹425 Crore Leverage Reset and Greenfield Gamble
Section 1 — At a Glance
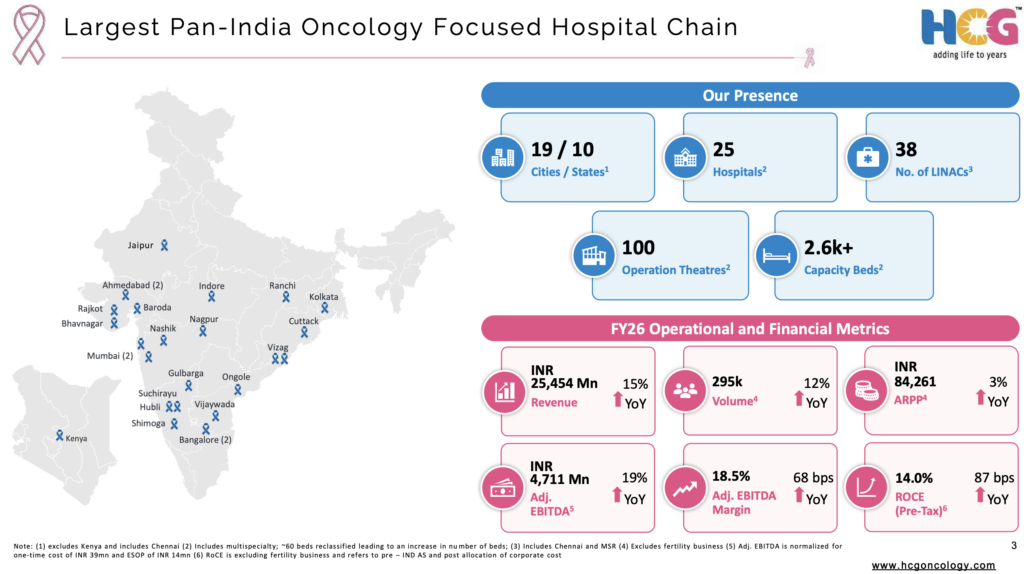
Healthcare Global Enterprises Ltd (HCG) closed its fiscal year 2026 with a topline performance that underlines its position as India’s dominant oncology force, yet its bottom line reveals a business caught in a massive structural and capital overhaul. For the full year ended March 31, 2026, consolidated revenue from operations climbed 14.5% to ₹2,545.41 crore, up from ₹2,218.14 crore in the previous fiscal year. Operating efficiency showed resilience as Adjusted EBITDA rose 18.9% to ₹4,711.30 crore, translating to an expanded adjusted margin of 18.5%. However, the headline numbers tell a tale of two realities: while operating profits surged, consolidated net profit plummeted by 69.0% to ₹13.76 crore from ₹44.41 crore in FY25. This severe bottom-line compression was driven by an extraordinary goodwill impairment charge of ₹31.91 crore linked to its fertility business and an incremental labor code impact of ₹12.70 crore. Investors are highly focused on the company’s structural pivot, anchored by the completed ₹424.68 crore rights issue designed to aggressively pay down a heavy borrowing book that reached ₹1,735.36 crore. On the operational front, worries linger over a deeply compressed Pre-Tax ROCE of 8.31%, weighed down by persistent gestation losses at emerging cancer centers. When a capital-intensive business scales via aggressive asset creation, the divergence between operating cash generation and accounting net profit widens significantly. The immediate roadmap depends entirely on how quickly HCG can sweat its newly commissioned greenfield assets and convert therapeutic trust into bottom-line returns.
Section 2 — Introduction
Healthcare Global Enterprises Ltd has entered a critical operational turning point. Long recognized as a specialized oncology powerhouse, the company’s aggressive expansion across India has left it holding a sprawling, asset-heavy clinical footprint. The current fiscal year represents a deliberate shift away from uncalibrated geographical spreading toward clinical consolidation and balance sheet de-risking. The launch of its flagship 132-bed comprehensive cancer hospital in Hebbal, North Bangalore—featuring Karnataka’s first MR-Linac technology—stands as a prime example of its high-tech clinical bets. Simultaneously, a sweeping leadership transition is underway following the resignation of key promoter-linked entities, with global fund Hector Asia Holdings expanding its controlling stake to 54.63%. With a clean financial structure post the rights issue and the complete divestment of its legacy non-core fertility brand, Milann, HCG is attempting to transition from an un-swept network of medical centers into a tightly run corporate platform. This analysis breaks down whether its clinical moats can finally translate into real investor returns.
Section 3 — Business Model: WTF Do They Even Do?
HCG operates a single-specialty healthcare platform dedicated almost entirely to longitudinal cancer care, supplemented by a fading footprint in reproductive medicine. The business model builds its economic moat around comprehensive oncology—integrating surgical, radiation, and medical oncology with advanced molecular diagnostics under one roof. Instead of relying on generic family-medicine footfalls, HCG acts as a tertiary referral terminal; approximately 45% of its patients arrive seeking second or third opinions after initial screenings at multi-specialty hospitals. Revenue is driven by high-value clinical sessions: medical chemotherapy represents the largest chunk at 38% of the operational mix, followed by surgical interventions at 21%, outpatient oncology services at 16%, and radiation delivery via linear accelerators (LINACs) at 14%. Operating across 25 hospitals, the company relies heavily on regional clusters, with mature hubs in Karnataka and Gujarat generating over half of total revenues.
Section 4 — Financials Overview
Figures are consolidated, in ₹ crore.
Quarterly Results Analysis
The final quarter of FY26 reflected continuous topline momentum, though trailing performance patterns indicate rising structural overheads.
Metric
Latest Quarter (Mar 2026)
YoY (%)
QoQ (%)
Revenue
₹652.33
+11.5%
+3.0%
EBITDA / Operating Profit
₹125.08
+16.0%
+14.2%
PAT
₹4.04
-81.0%
Normalised
EPS
₹0.15
-89.6%
Normalised
Note: YoY and QoQ comparisons for PAT and EPS reflect sharp accounting movements due to a ₹31.91 crore goodwill impairment recorded under extraordinary items in Q4 FY26.
The sequential revenue expansion was supported by a 12% growth in patient volumes and a steady 3% ticking up of Average Revenue Per Occupied Bed (ARPOB) to ₹84,261 across the network. The widening gap between an impressive 19.17% quarterly operating margin