Dodla Dairy FY26: The ₹4,125 Crore Topline and the Bitter Sweet Aftertaste of Expensive Milk
Section 1 — At a Glance
Dodla Dairy Limited closed the fiscal year 2026 with an all-time high consolidated revenue of ₹4,125.2 crore, marking a 10.9% growth year-on-year. However, this expansion has come at a severe cost to operating efficiency. While the dairy processor successfully breached the ₹1,000 crore quarterly revenue threshold in every single quarter of the fiscal year, its structural profitability felt the heavy squeeze of a structural supply crunch. Consolidated EBITDA for FY26 collapsed by 19% to ₹308.5 crore from ₹380.8 crore in the previous year, dragging the operating margin down from a double-digit 10.2% to a muted 7.5%.
Consolidated FY26 Performance
Metric
FY26 Value
Year-on-Year (YoY) Change
Operating Revenue
₹4,125.2 Cr
▲ 10.9%
EBITDA
₹308.5 Cr
▼ 19.0%
Profit After Tax (PAT)
₹267.0 Cr
▲ 2.7%
The primary culprit behind this margin contraction is an unprecedented raw milk procurement shock. Average procurement prices jumped 9.7% to ₹40.2 per liter during the first nine months of the year, up from ₹36.0 per liter in the previous period. Faced with aggressive milk cooperatives and severe climate-induced raw material shortages, management consciously deferred comprehensive consumer price hikes to prioritize market share retention.
Paradoxically, net profit managed to post a modest 2.7% gain to reach ₹267.0 crore. This bottom-line growth was almost entirely engineered by a massive ₹58.7 crore aggregate income tax credit windfall harvested over multiple quarters, following favorable rulings from the Income Tax Appellate Tribunal (ITAT). Operating profits are highly sensitive to raw input dynamics, meaning that when volume gains are achieved purely by absorbing procurement inflation, the resulting earnings profile becomes fundamentally fragile. With a net cash balance sheet supporting massive, debt-free capital expenditures across Maharashtra and East Africa, the street is left evaluating a complex mix: robust geographical volume growth countered by near-term margin erosion.
Section 2 — Introduction
Dodla Dairy Limited has evolved from its mid-90s foundations in Telangana into a highly aggressive multi-state integrated dairy operator. The company has expanded beyond its traditional southern stronghold to capture a wider consumer base. It handles raw milk sourcing, cold-chain logistics, processing, and direct-to-retail distribution via its branded ecosystem.
This financial analysis unpacks the company’s full-year FY26 results and its high-stakes operational restructuring. Over the past twelve months, Dodla has completed the full acquisition of HR Food Processing (OSAM Dairy) in Eastern India, entered new procurement corridors in Maharashtra, and greenlit massive production facilities in Uganda. This article cuts through the headline volume expansion to evaluate whether Dodla’s capital expenditure spree will generate high-yielding returns or simply dilute return metrics.
Section 3 — Business Model: WTF Do They Even Do?
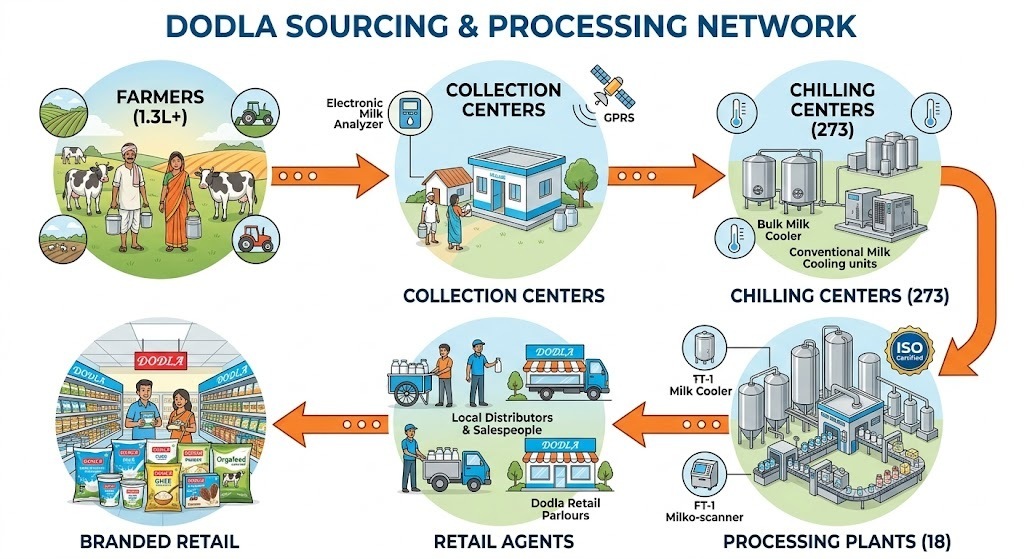
At its core, Dodla functions as a massive, high-velocity collection and distribution pipeline. It bypasses middlemen by directly sourcing 98% of its raw milk requirements from an unorganized army of over 1.3 lakh dairy farmers across 10,970 villages. The liquid milk is moved rapidly through 273 chilling centers to 18 automated processing units across India and East Africa.
The revenue mix relies on two pillars: standard pasteurized pouch liquid milk and value-added products (VAPs) like curd, ghee, paneer, lassi, and ice cream. While liquid milk handles the heavy volume lift, VAPs act as the margin engine. Additionally, through its subsidiary Orgafeed, Dodla sells cattle feed directly back to its farmer network, cleverly docking the feed costs from the periodic milk procurement payouts. It’s a closed-loop system designed to secure raw materials, but it remains highly exposed to changing environmental conditions.
Section 4 — Financials Overview
Figures are consolidated, in ₹ crore.
Operational Comparison Table
Metric
Q4 FY26
YoY
QoQ
Revenue
1,074.5
▲ 18.1%
▲ 4.8%
EBITDA / Operating Profit
53.8
▼ 35.6%
▼ 32.2%
PAT
69.7
▲ 2.6%
▲ 1.5%
EPS (in ₹)
11.56
▲ 2.3%
▲ 1.4%
(Note: Data derived from Data Sheet and explicit presentation metrics. Summary values reflect minor rounding variations present in official tables).
The financial trend lines show a distinct divergence between top-line expansion