Sintercom India Mar 2026 : Earnings Explode 960% as Sintering Niche Finally Gains Traction
Section 1 — At a Glance
Sintercom India Ltd has delivered an intriguing conclusion to its fiscal year ended March 31, 2026, catching investor attention with a massive headline metric: a 960% year-on-year surge in quarterly profit after tax. Revenue from operations climbed past the milestone mark to reach ₹100.70 crore for the full fiscal year. This top-line momentum marks an acceleration after multiple years of rangebound performance, where revenues sat flat between ₹82 crore and ₹90 crore, held back by client execution delays and shifting order timelines.
While the sharp recovery in corporate earnings provides immediate relief, deep capital allocation inefficiencies continue to weigh down long-term value creation. Gross current assets have historically remained bloated, driven by highly intensive working capital cycles and an inventory strategy required by the niche nature of powder metallurgy manufacturing. The divergence between reported profitability and operational cash generation remains a core analytical focal point. Profits on a ledger are merely an opinion, whereas cash flow is a hard reality. Net profit after tax expanded to ₹1.43 crore for FY26 , yet the enterprise remains tightly bound by high short-term utilization of its credit lines. The core question is whether this earnings breakout represents a sustainable fundamental pivot or a temporary high-water mark.
Section 2 — Introduction
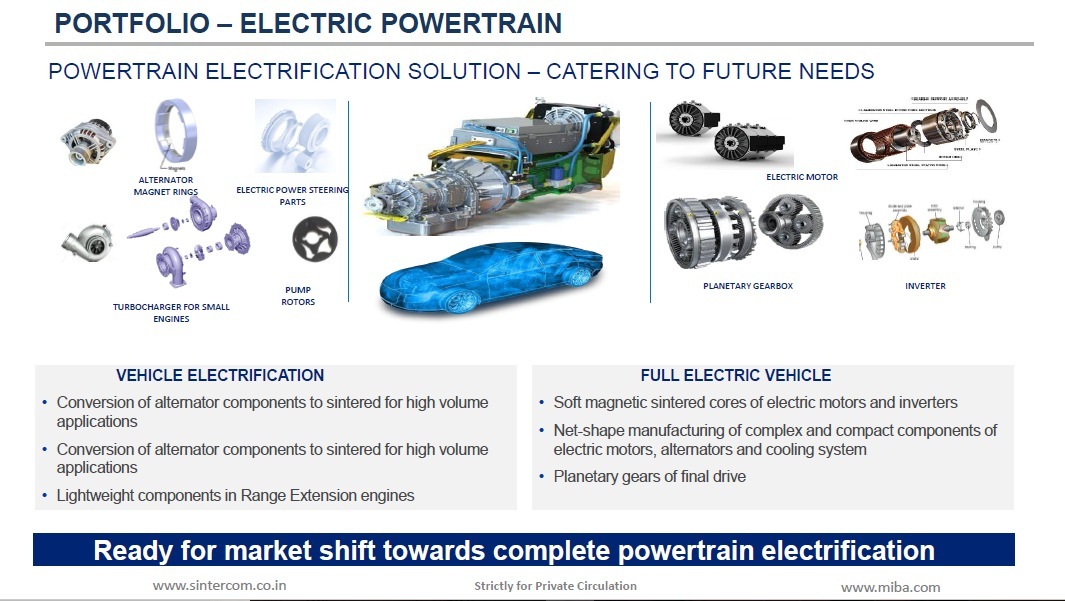
Sintercom India operates at the highly technical intersection of material sciences and automotive engineering. Established in 2007, the company has spent over a decade anchoring itself as one of India’s few specialized manufacturers of high-density sintered metal components. Sintering is a manufacturing methodology that presses metal powders into high-precision structural shapes, minimizing mechanical machining and material wastage.
The smallcap entity has spent substantial capital building out its technological base, yet its real market relevance stems from its heavy integration into Tier-1 auto component ecosystems and passenger vehicle OEMs. After years of rangebound financial performance that left public market participants frustrated, a fresh 3-year export pipeline and realigned domestic platforms have pushed the company into focus. This deep dive analyzes whether Sintercom is finally translating its structural capabilities into high-yielding economic returns.
Section 3 — Business Model: WTF Do They Even Do?
Sintercom manufactures metal components that must survive extreme stress, high friction, and blistering temperatures. Instead of carving parts out of solid steel blocks, they take specialized metal powders, compress them under immense pressure, and bake them just below their melting point until the particles fuse.
Their product catalogue spans engine sprockets, transmission synchro hubs, ABS rings, and sensor flanges. The revenue distribution is heavily weighted toward high-precision applications:
Engine Segment: Generates approximately 59% of product revenues.
Transmission Segment: Contributes 39%.
Body & Chassis Components: Makes up the remaining 2%.
While they command strategic partnerships—including a technology-sharing arrangement with global sintering giant Miba Sinter —the business model is fundamentally a high-fixed-cost, customized operation. They manufacture 60 distinct products, but here is the catch: they act as a single-source supplier for 80% of these parts. If Sintercom stops production, their clients’ assembly lines freeze. This commands high customer stickiness but forces Sintercom to hold excessive buffer stock, transforming the balance sheet into a massive storage unit.
Section 4 — Financials Overview
Figures are consolidated, in ₹ crore.
Quarterly Comparison Table
Metric
Latest Quarter (Mar 2026)
YoY (Mar 2025)
QoQ (Dec 2025)
Revenue
27.52
24.11
25.80
EBITDA / Operating Profit
4.88
3.86
4.15
PAT
0.53
0.05
0.37
EPS (₹)
0.19
0.02
0.13
The quarterly trajectory illustrates an operational unlocking. Top-line revenue for the quarter grew 14.1% year-on-year to ₹27.52 crore. More importantly, operational leverage kicked in, pushing EBITDA up to ₹4.88 crore. The 960% explosion in PAT from a tiny base of ₹0.05 crore to ₹0.53 crore highlights how minor changes in capacity utilization drop straight to the bottom line. When fixed asset bases are highly capital-intensive, incremental revenue expansions create disproportionate margin expansions.