Varun Beverages Q1 CY2026: Revenue Jumps 18.1%, PAT Rises 20.1%, But Valuation Still Demands a Cold Drink and a Calculator
Date of Publishing -
Spotted a factual error — a wrong number, date, or fact? Tell us and we will check the source.
1. At a Glance
Varun Beverages has entered Q1 CY2026 with the confidence of a company that knows summer is its boardroom ally. Net revenue rose 18.1% YoY to ₹65,741.9 million, EBITDA grew 21.0% YoY to ₹15,289.3 million, and PAT increased 20.1% YoY to ₹8,787.1 million.
The story looks strong. Volumes rose 16.3% YoY to 363.4 million cases, with India growing 14.4% and international markets growing 21.4%. This is not a sleepy beverage quarter. This is a company loading trucks, chilling bottles, acquiring assets in South Africa, and trying to make Africa a much larger part of its growth machine.
But the valuation is not exactly served with ice. At a market cap of around ₹1,75,373 crore and price of ₹519, the stock trades at a recalculated annualised P/E of roughly 50.3x using Q1 CY2026 EPS of ₹2.58 × 4 = ₹10.32. Using TTM EPS of around ₹9.40–₹9.41, the P/E is closer to 55x.
So the detective question is simple: is this premium backed by execution, or is the market already pricing in every bottle VBL will sell from Delhi to Durban?
2. Introduction
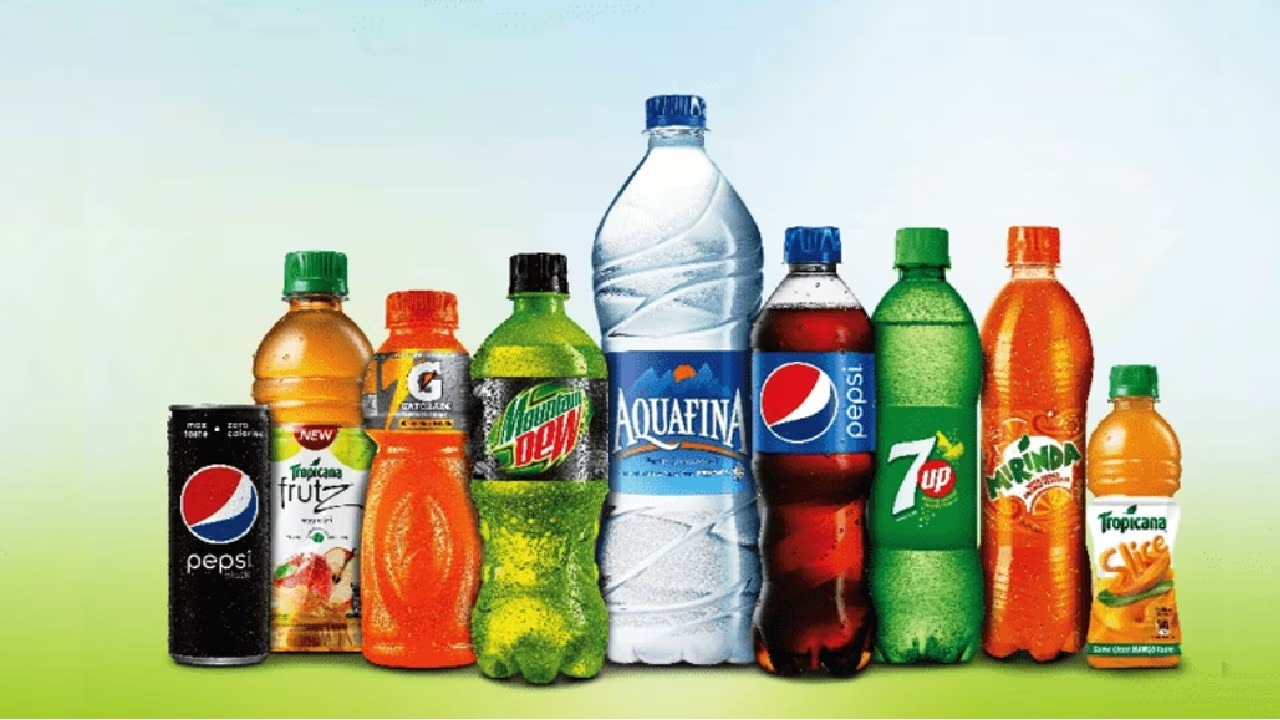
Varun Beverages is one of PepsiCo’s largest franchise bottlers globally outside the US. It manufactures and distributes Pepsi, 7UP, Mountain Dew, Mirinda, Sting, Tropicana, Slice, Aquafina and other PepsiCo-linked products. It also has own and licensed brands like CreamBell in certain categories.
The business has two important engines.
First, India. It remains the core market, with deep distribution, manufacturing capacity, visi-coolers, and an expanding product portfolio.
Second, international markets, especially Africa. This is where the plot thickens. VBL has already integrated BevCo, completed the Twizza acquisition in South Africa, and has agreed to acquire Crickley Dairy. Management is clearly not going to Africa for tourism.
Q1 CY2026 shows both engines firing. India volume growth was healthy, international growth was stronger, and margins improved despite higher depreciation and finance costs.
The main risk is not growth. The main risk is valuation discipline.
3. Business Model – What Do They Even Do?
VBL is not a cola brand owner in the purest sense. PepsiCo owns the brands, formulations, and large consumer marketing engine. VBL handles execution: manufacturing, bottling, distribution, warehousing, chilling infrastructure, local activation, and market servicing.
In simple terms, PepsiCo creates the desire. VBL makes sure the bottle reaches the shop before the customer changes their mind.
The model depends on scale. More volume improves plant utilisation, route economics, procurement, working capital, and distribution productivity. That is why VBL talks so much about capacity, trucks, coolers, backward integration, and route-to-market.
The company also manufactures several packaging inputs internally, including PET preforms, closures, corrugated boxes, shrink films and related materials. This gives it better cost control.
The business looks simple from outside: sell beverages.
Inside, it is logistics, temperature control, seasonality, franchise economics, capex timing, and execution discipline. A chilled bottle is easy to drink, but difficult to deliver profitably at national scale.
4. Financials Overview
The company presentation reports figures in ₹ million. For readability, the table below keeps the original ₹ million reporting unit.
Management had earlier said CY2026 could be a better operating leverage year if weather normalised. Q1 CY2026 broadly supports that comment: volume growth returned strongly, EBITDA margin improved, and India margin benefited from volume growth and gross margin improvement.
So yes, management seems to be walking the talk so far. Not sprinting, but walking with a loaded cooler.