Search for stocks /

Lodha Developers Q4 FY26: ₹20,530 Crore Pre-Sales, 24% PAT Growth, 0.23x Net Debt — Is This a Real Estate Company or a Compounding Machine?

1. At a Glance — India’s Builder or India’s Quiet Financial Engineer?

Indian real estate has usually been a soap opera.

Too much debt.
Too many launches.
Too many promises.
And usually, too little cash.

Then comes Lodha Developers behaving suspiciously like… a disciplined compounder.

Pause and look at the absurdity:

  • FY26 Pre-sales: ₹20,530 crore
  • PAT: ₹3,431 crore, up 24%
  • Net debt down to ₹5,377 crore
  • Net D/E just 0.23x
  • FY26 EBITDA margin ~34%
  • Five-year PAT up over 6x
  • Stock P/E 24.5 vs several peers above 30–60x

That is not normal developer behaviour.

That is almost… offensive to stereotypes.

While many developers still sell dreams on hoardings, Lodha seems to be selling houses, monetising land, building annuities, flirting with data centers, and deleveraging simultaneously.

Who does all four at once?

Either a genius.

Or a maniac.

Sometimes same thing.

And here’s the drama nobody is noticing:

The market is treating this like “just another cyclical realty stock.”

But management is trying to morph it into something stranger:

Developer + annuity platform + digital infrastructure optionality + land bank call option.

That’s not a builder. That’s almost a listed urbanization platform.

And then the kicker…

~600 million sq ft land bank.

Read that again.

600 million.

That’s not inventory.

That’s territorial ambition.

Question for readers:

Is this still a real estate stock…
or a hidden infrastructure compounder pretending to be one?

Because if Palava data center economics work even half as management claims, this story may stop being about apartments.

And start being about power, servers and recurring cash flows.

That is where the plot thickens.


2. Introduction — The Builder That Started Acting Like a Banker

Indian developers traditionally borrow short, build slow, pray fast.

Lodha seems doing reverse.

Collect early.
Launch smart.
Use JDs instead of heavy land ownership.
Keep leverage low.

Very un-Indian-builder behaviour.

Suspicious.

Management in old concalls kept saying:

“We will front-load business development now, then shift toward cash generation and profit focus.”

Usually management says such things.

Then buys expensive land.

Then shareholders cry.

But here…

FY26 GDV additions ₹60,000 crore.

And simultaneously net debt fell.

Management actually walked the talk. Rare species sighting.

Even funnier:

Rating upgrades from A to AA stable in few years.

In Indian finance, rating upgrades for developers are rarer than honest “last price” in property negotiations.

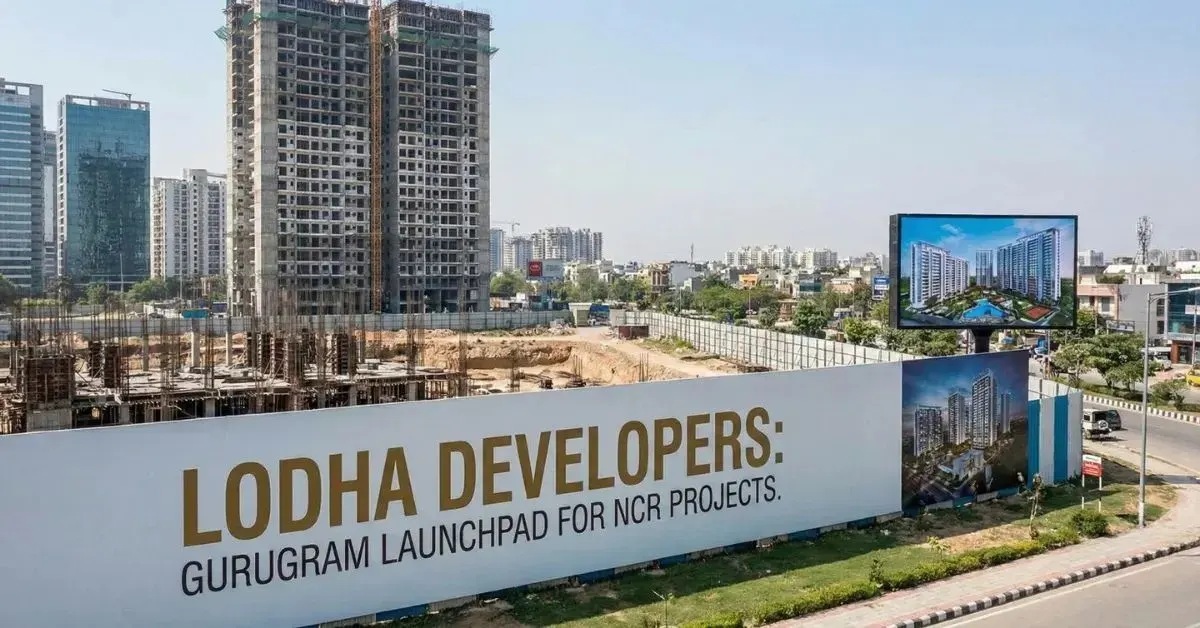
And then this delicious irony:

They’re entering NCR while others are trying to survive existing markets.

Expansion during discipline.

That’s confidence.

Or madness.

Again, thin line.


3. Business Model — What The Hell Do They Actually Do?

At surface:

Sell apartments.

But that is kindergarten description.

Actually four engines:

DevCo

Luxury + premium + mid-income housing machine.

This funds everything.

Cash cow.

LandCo

Massive township optionality.

Palava alone almost behaves like a hidden city-state.

Feels less “project”, more “urban empire”.

RentCo

Retail
Warehousing
Office
Data centers

Annuity target 10x over six years.

Now we’re no longer talking developer multiples.

This starts inviting platform multiples.

Dangerous rerating territory.

Data Center Optionality

Now this is where story becomes spicy.

400 acres.
3 GW power.
AWS and STT anchors.

This could be gold.

Or expensive powerpoint poetry.

We’ll know.

But optionality exists.

And market rarely prices optionality properly.


4. Financials Overview — Numbers Talking Loudly

Quarterly Results detected. EPS annualisation rule locked.
Latest Q4 EPS = 10.09
Annualized unnecessary because Q4 full-year EPS available = 34.32.

Financial Comparison

MetricQ4 FY26Q4 FY25QoQ (Q3 FY26)
Revenue471442244672
EBITDA141312201415
PAT1008923958
EPS10.099.249.58

(₹ crore)

Observations:

Revenue +11.6%

PAT +9%

Margins stable.

No heroics.

Just compounding.

That’s often scarier.

Full Year Snapshot

MetricFY25FY26
Revenue13,78016,676
EBITDA3,9874,921
PAT2,7673,431
EPS27.7134.32

And now valuation comedy:

P/E = 841 / 34.32 ≈ 24.5

For 20%+ growth.

PEG ~0.43

That almost looks illegal.


5. Valuation Discussion — Fair Value Range

Method 1 P/E

Assume 25-32x on FY26 EPS 34.32

Value:

₹858 to ₹1,098


Method 2 EV/EBITDA

EV ₹90,294 crore
EBITDA ₹4,921 crore

16.8x current.

At 15–18x:

Range roughly:

₹800–1,050 implied.


Method 3 Simplified DCF

Assume:
FCF growth 15–18%
Discount 12%

Range:
₹950–1,200


Fair Value Educational Range:

₹850–₹1,200

This fair value range is for educational purposes only and is not investment advice.

Interesting part?

Stock at ₹841 sits near lower end.

That’s where things get awkward.


6. What’s Cooking — News, Triggers, Drama

Things cooking:

  • ₹1.3 lakh crore data center ambition
  • NCR entry
Join 10,000+ investors who read this every week.
Become a member
error: Content is protected !!