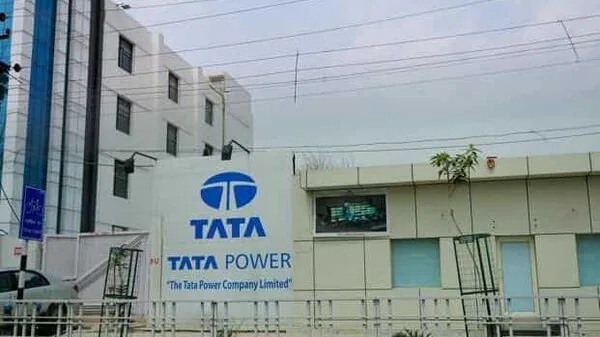
Tata Power:
₹1,194 Cr PAT. 31.7x P/E.
India’s Power Chaos, Packaged Neatly.
A 1.2 trillion watt-hour conglomerate trying to fix grid shortages while manufacturing solar panels, running distribution networks, and restarting an orphaned coal plant that won’t cooperate.
The Vertically-Integrated Power Company That’s Everywhere, Focused Nowhere
- 52-Week High / Low₹417 / ₹332
- Q3 FY26 Revenue₹13,948 Cr
- Q3 FY26 PAT₹1,194 Cr
- Q3 FY26 EPS₹2.42
- 9M FY26 PAT₹3,702 Cr
- Book Value₹118
- Price to Book3.18x
- Dividend Yield0.60%
- Debt / Equity1.86x
- Return (1-Year)+6.84%
The Power Company That Needs Itself To Fix India’s Power Problem
Tata Power is India’s largest vertically-integrated power company. And by “vertically-integrated,” we mean: they generate electricity (coal, hydro, renewable), transmit it across 4,633 circuit kilometers, distribute it to 12.5 million consumers in Delhi, Odisha, and Mumbai, manufacture solar panels at 4.5 GW capacity, build rooftop solar systems, operate EV charging stations, and somehow found time to invest in Bhutanese hydropower. That’s not a company. That’s a state trying to privatize itself.
The last three years tell two stories. Revenue grew 15% compounded. Profit grew 21% compounded. But return on invested capital is 10.8%, which means they’re earning barely more than their debt costs. The stock is up 28% over five years, compounded. But if you bought at the 2021 peak, you’re still down. And the dividend yield is 0.60% — which raises the eternal question: why hold this stock if growth is slowing and income is negligible?
Q3 FY26 gave us some answers. PAT of ₹1,194 crore was buoyed by regulatory true-up orders at their Delhi distribution arm (TPDDL), which added ₹344 crore in profit for the quarter. Manufacturing at their solar plant turned a corner with 154% year-on-year profit growth. And their Odisha distribution turnaround is now translating into cash — ₹800 crore in a single quarter. But Mundra, their flagship coal plant, remains offline. And management won’t say why.
Welcome to the power sector’s big, messy, ambitious reality. Where growth matters less than regulatory largesse, and execution competes with government cooperation.
Generation, Transmission, Distribution, Manufacturing, Rooftop, EV Charging, And Somehow, Still Growing
Tata Power’s business is split into four segments, and it’s genuinely hard to know where to start:
Transmission & Distribution (62% of 9M FY26 revenue): They operate transmission lines across 6 states and distribution in Mumbai (0.5% AT&C loss, meaning they’re world-class at not losing power to theft or technical failure), Delhi via TPDDL (5.6% losses, improving), Odisha (four separate discoms), and Ajmer. Total: 12.5 million retail consumers. This is the cash machine with regulatory pricing. Bad returns, good stability.
Thermal & Hydro (24% of revenue): They own 9,300+ MW of thermal capacity across coal, gas, and oil, plus 880 MW of hydro. Mundra is their flagship imported-coal plant and was running beautifully until it wasn’t. Plant load factors range from 44% (hydro) to 74% (non-Mundra thermal). Economics are hurt by coal inflation, grid curtailment, and merchant power oversupply.
Renewables (13% of revenue): 5,384 MW across solar and wind. But here’s where it gets weird: they’re executing 2.7 GW of renewable capacity in FY26 (including third-party EPC), while simultaneously expanding their own manufacturing. Solar cell capacity is 4.5 GW (with 300 MW coming Q4). Solar module capacity is 4.9 GW. They’re essentially building the grid and the equipment to power it.
Others (1% of revenue): Rooftop solar, EV charging (1.3+ lakh stations), project management, and various adjacent bets.
Q3 FY26: The Numbers Game
Result type: Quarterly Results | Q3 FY26 EPS: ₹2.42 | Annualised EPS (Q3×4): ₹9.68 | Current P/E on Annualised: 38.8x
| Metric (₹ Cr) | Q3 FY26 Dec 2025 | Q3 FY25 Dec 2024 | Q2 FY26 Sep 2025 | YoY % | QoQ % |
|---|---|---|---|---|---|
| Revenue | 13,948 | 15,391 | 15,545 | -9.4% | -10.3% |
| Operating Profit | 3,042 | 3,079 | 3,302 | -1.2% | -7.9% |
| OPM % | 22% | 20% | 21% | +200 bps | +100 bps |
| PAT | 1,194 | 1,188 | 1,245 | +0.5% | -4.1% |
| EPS (₹) | 2.42 | 3.23 | 2.88 | -25.1% | -16.0% |
31.7x Is Not Reasonable. But Is It Inevitable?
Method 1: P/E Based
FY25 full-year EPS = ₹12.43. Current P/E = 31.7x. Annualised Q3 EPS (Q3×4) = ₹9.68, which implies P/E of 38.8x on run-rate. Justified P/E for a power utility with 11% ROCE should be 12x–16x. Tata Power trades at 2x+ that premium.
Fair Value Range: ₹235 – ₹315
Method 2: EV/EBITDA Based
FY25 EBITDA = ₹12,166 Cr. Enterprise Value = ₹1,80,668 Cr. EV/EBITDA = 14.8x. Utilities typically trade at 8x–12x. High debt (D/E 1.86x) and capex intensity inflate the multiple.
EV range (10x–12x): ₹1,21,660 Cr – ₹1,45,992 Cr → Per share:
Range: ₹255 – ₹305
Method 3: DCF Based
Operating cash flow: ₹12,680 Cr (FY25). Capex intensity: ₹15,436 Cr (FY25) invested. FCF = OCF – Capex = -₹2,756 Cr. They’re burning cash on a GAAP basis. Long-term, management targets 2.5–3 GW of own renewable additions per year.
Note: DCF is unreliable when capex exceeds cash generation. A utility in expansion mode doesn’t work well with terminal value assumptions.
Indicative Range: ₹250 – ₹320
Why Is India’s Power Company Keeping Secrets About Coal?
🚨 Mundra: The Elephant In The Room That Won’t Be Acknowledged
Tata Power’s 4,620 MW Mundra imported coal plant ran beautifully until Q2 FY26. Then it shut down. In Q3, it was still offline. Management says they’re working on a “Supplementary PPA” (SPPA) with procurers. Translation: the original PPAs are uneconomical and they need government permission to renegotiate. The plant is losing ₹800 crore per quarter in capacity charges. CEO said closure is “maybe by the end of this month” (as of Feb 2026 concall). But there’s “one point” from government that’s unresolved. What point? Management refused to say. Quote: “There is one point. Let’s wait for that clarity to come from the government.” This is a ₹10,000 crore asset sitting idle, and the company is publicly admitting they don’t understand the terms of its revival.
✅ Manufacturing & Rooftop Inflection
- • Solar cell/module manufacturing PAT: ₹592 Cr in 9M (+154% YoY)
- • Q3 margin: 28% on manufacturing, ₹251 Cr profit
- • Rooftop execution: 1 GW crossed in 9M; Q3 executed 372 MW
- • Rooftop PAT: ₹324 Cr in 9M vs ₹110 Cr last year
- • CEO: margins “will only improve… will not become worse”
⚠️ The DCR Shift & Capex Reality
- • From June 2026: all DCR (domestic content rules) cells/modules mandatory
- • Tata Power has 4.5 GW cell capacity, 4.9 GW module capacity
- • But they’re also the EPC partner building these projects
- • FY26 capex: ₹40,000 Cr annualized run rate
- • Debt/equity already at 1.86x and rising
✅ Distribution Turnaround (Odisha Surprise)
- • Q3 Odisha profit: ₹226 Cr (vs ₹86 Cr last year)
- • 9M profit: ₹505 Cr (vs ₹164 Cr)
- • Q3 cash generation: ~₹800 Cr just from Odisha
- • AT&C losses improving: less power theft
- • CEO: “Not many players have this skill set… in distribution”
⚠️ Renewable Execution Bottleneck
- • Grid connectivity is the real bottleneck, not demand
- • FY26 target: 2.7 GW commissioned (FY27: 2.5–3 GW)
- • ~40 GW of signed PPAs awaiting transmission approval
- • Phase-wise commissioning to match evacuation readiness
- • Risk: capacity sitting idle waiting for grid connection
₹70,000 Crore In Debt. Because Capex Never Stops.
| Item (₹ Cr) | Mar 2023 | Mar 2024 | Mar 2025 | Sep 2025 (Latest) |
|---|---|---|---|---|
| Total Assets | 128,096 | 139,054 | 156,193 | 163,801 |
| Equity (Net Worth) | 28,468 | 32,036 | 35,521 | 37,370 |
| Borrowings | 52,923 | 53,689 | 62,866 | 70,083 |
| Other Liabilities | 46,386 | 53,010 | 57,487 | 56,028 |
| Total Liabilities | 128,096 | 139,054 | 156,193 | 163,801 |
Borrowings rose ₹17,194 Cr in 2.5 years. Debt/Equity ratio is 1.86x, which is at the upper limit of comfort for regulated utilities. If interest rates tick up or ROCE stays at 10.8%, debt servicing becomes a pressure point.
Equity looks healthy on paper (+₹8.9 Cr in 2.5 years). But this is because of profit retention. Dividend payout is only 18.9% of earnings, which is cautious. Low dividend yield (0.60%) means you’re not getting paid to wait.
Total assets grew to ₹163,801 Cr. Fixed assets account for ₹79,210 Cr of that. This is not a light-touch business model. Every rupee of growth requires more debt and more fixed assets sitting on the books.
₹12,680 Crore Operating Cash vs ₹15,436 Crore Capex = Negative FCF
| Cash Flow (₹ Cr) | FY23 | FY24 | FY25 | 9M FY26 Annualized |
|---|---|---|---|---|
| Operating CF | +7,166 | +12,504 | +12,680 | ~₹16,900 Cr |
| Investing CF | -7,263 | -8,935 | -15,436 | ~₹20,581 Cr |
| Financing CF | +1,341 | -4,497 | +4,292 | Dependent on capex pace |
| Net Cash Flow | +1,243 | -928 | +1,536 | Borrowing dependent |
High Growth Numbers Masking Low Returns
Annual Trends — FY23 to FY25 (Full Year)
| Metric (₹ Cr) | FY23 | FY24 | FY25 |
|---|---|---|---|
| Revenue | 55,109 | 61,449 | 65,478 |
| Operating Profit | 7,728 | 10,735 | 12,166 |
| OPM % | 14% | 17% | 19% |
| PAT | 3,810 | 4,280 | 4,775 |
| EPS (₹) | 10.44 | 11.57 | 12.43 |
Revenue and earnings are growing steadily, which is good. OPM improved significantly because manufacturing and rooftop became profitable. But absolute earnings growth (8.7% CAGR) is below revenue growth (9%), which means margin expansion came from mix improvement, not operational leverage. Sustainable, but not exceptional.
Tata Power vs The Power Pack (Looks Worse In Context)
| Company | Revenue (₹ Cr) | PAT (₹ Cr) | P/E | ROCE % | D/E Ratio |
|---|---|---|---|---|---|
| Tata Power | 64,624 | 3,782 | 31.7x | 10.8% | 1.86x |
| Adani Power | 54,255 | 11,454 | 23.4x | 22.5% | 0.63x |
| Torrent Power | 29,017 | 3,158 | 23.6x | 15.9% | 0.49x |
| CESC | 18,351 | 1,473 | 13.8x | 11.2% | 0.62x |
| Reliance Infra | 20,547 | 4,976 | 0.77x | 34.0% | N/A |
Sector median P/E: 23.5x. Tata Power at 31.7x is a 35% premium to peers. But ROCE of 10.8% is the lowest in the peer set (except India Power Corp, which is uninvestable). Adani Power earns 22.5% ROCE at 23.4x P/E. That’s a bargain in comparison.
The Tata Group’s Bet on India’s Power Future
- Promoters (Tata Sons, Steel, etc.)46.86%
- Public25.60%
- DIIs (incl. LIC)17.20%
- FIIs10.00%
Pledge: 0.00%. 42.4 million shareholders. Promoter locked in without pledging. Tata Sons is rated AAA (Stable) by ICRA.
Tata Sons: The Hidden Hand
Promoter holding is 46.9%, primarily through Tata Sons Private Limited (45.21%), plus other Tata entities. Tata Sons has a 10-generation track record and is rated AAA (Stable). But here’s the thing: Tata Power is just one power company in Tata’s portfolio. Strategic decisions are often made at the group level, not the company level. That’s not always transparent to public shareholders.
LIC at 5.18% (And Counting)
Life Insurance Corporation of India holds ~5.18% of Tata Power. That’s your mother’s insurance policy, indirectly betting on India’s power infrastructure. LIC has been buying utilities for decades because they need stable income assets. If LIC is comfortable with the long-term story, that’s a datapoint. But it’s not a buy signal.
Rated AA+ (Stable), But Holding Classified Information
✅ The Formal Checklist
- ✓ ICRA rated [ICRA]AA+(Stable) in Jul 2025 for term loans (₹4,100 Cr)
- ✓ Annual reports filed on schedule, audit clean
- ✓ Quarterly concalls held consistently (Feb 2026 most recent)
- ✓ Regular board meetings, audit committee active
- ✓ Postal ballot approved ₹52,454 Cr in related-party transactions Feb 2026
- ✓ Promoter pledge: 0.00%
⚠️ The Transparency Gaps
- ⚠ Mundra restart status: “one point” from government, details classified
- ⚠ Regulatory asset accounting: lumpy true-ups dominate quarterly results
- ⚠ SPPA negotiations: terms and timelines are opaque
- ⚠ Related-party transaction volume: ₹52,454 Cr across Tata ecosystem
- ⚠ Section 11 risk: CEO waved it away, but it remains a legal overhang
Why Tata Power’s Struggles Reflect The Industry’s Dysfunction
India’s power sector is caught in a structural bind. Demand is rising at 6–7% per year (healthy). But coal supply remains tight, renewable capacity is ballooning, and grid infrastructure can’t evacuate all the capacity that’s being built. Tata Power is executing 2.7 GW of renewable capacity in FY26. But ~40 GW of signed PPAs are awaiting transmission connectivity. Translation: they’re building power plants that can’t sell power because the grid isn’t ready.
💰 The Merchant Tariff Trap: Overcapacity Meets Undersupply
India added 45 GW of capacity in FY26, of which 38 GW is renewable. But peak demand growth is only 7% annually. Result: plant load factors (PLF) are declining. Hydro at 44% PLF, wind at 22%, solar at 22%. Coal plants run at 74% because they’re dispatchable. But coal supply is constrained and expensive. Tata Power’s Mundra plant earns better returns than their renewable fleet because it’s running 24/7. But it’s offline. So they’re burning margin on lower-capacity renewables while waiting for the government to fix one mysterious “point.”
🚨 The Regulatory Roulette: True-ups vs Operational Reality
29% of Tata Power’s Q3 profit came from TPDDL’s regulatory true-up order. That’s not sustainable. Distribution companies in India are politically sensitive—tariff hikes face state opposition, AT&C loss reduction is painfully slow, and regulatory asset determination is opaque. A smart utility funds growth from operations. Tata Power funds growth from borrowed debt and occasional regulatory windfall. That’s not prudent capital allocation.
⚡ The EV Charging Non-Sequitur
Tata Power operates 1.3+ lakh EV charging stations. But EV penetration in India is below 3% of new vehicle sales. The company is building infrastructure for a market that doesn’t exist yet. Viable business in 2030, maybe. Cash drain in 2026, certainly. It’s strategic optionality, but the optionality is costing real cash today.
✅ The Manufacturing Inflection (One Real Bright Spot)
Solar cell and module manufacturing is finally profitable. With DCR (domestic content rules) mandating local manufacturing from June 2026, Tata Power’s 4.5 GW cell capacity and 4.9 GW module capacity will see structural demand. Margins at 28% (manufacturing EBITDA) are real. If they can sustain 24%+ margins as capacity utilization rises, this segment could contribute 15–20% of group profit by FY28. That’s material.
Competitive Advantage Analysis: Adani Power dominates with 22.5% ROCE because they’re focused—coal, renewables, some hydro. They’re not trying to fix India’s distribution sector simultaneously. Tata Power’s vertical integration looks good on paper but destroys capital in practice. CESC is pure distribution (Mumbai), with lower growth but higher ROCE (11.2%) because they don’t fund capex-heavy renewables. Torrent Power is distribution + solar, and hitting 15.9% ROCE. Tata Power is trying to do everything and excelling at nothing except distribution (which they’re forced to run at regulated returns).
The Power Play That Doesn’t Quite Add Up
Tata Power is trying to solve India’s power problem while simultaneously making money. Those two goals aren’t always aligned. 10.8% ROCE on a 12%+ cost of capital means they’re value-destructive at the margin. 31.7x P/E trades at a 35% premium to peers. ₹70,083 crore in debt is rising faster than equity. And their flagship coal plant is offline for reasons they won’t disclose.
What Worked in 9M FY26: Manufacturing (PAT +154% YoY), rooftop solar (PAT +194% YoY), and Odisha distribution (PAT +208% YoY). Regulatory true-up at TPDDL added ₹460 Cr EBITDA. Operating margin improved 200 bps. If these trends continue and Mundra restarts, Q4 could be solid.
What Didn’t Work: Revenue fell 9.4% YoY in Q3 because Mundra was offline. EPS fell 25% YoY for the same reason. Free cash flow is negative because capex (₹15,436 Cr) exceeds operating cash (₹12,680 Cr). ROCE of 10.8% is barely above cost of capital. Debt levels are rising. And management is keeping the terms of Mundra’s restart confidential.
The Valuation Story: Fair value range is ₹235–₹320, implying 17% downside from current price of ₹376. The stock has run hard (+6.8% in 1 year, +21% in 3 years), pricing in a narrative of “India needs power + Tata Power builds it = growth.” But growth at 10.8% ROCE is a burden, not a benefit. Adani Power earns 22.5% ROCE and trades at 23.4x. CESC earns 11.2% ROCE and trades at 13.8x. Tata Power’s premium isn’t justified by returns.
Base Case (₹290–₹310): Mundra restarts by Q4 FY26. Manufacturing continues inflection. Odisha turnaround sustains. Debt stabilizes at 1.8x. ROCE remains flat at 10.8–11%. Stock re-rates downward as market realizes growth ≠ value creation.
Bull Case (₹340–₹380): Mundra restart announced imminently with favorable terms. DCR manufacturing margins hold at 28%+. Group ROCE climbs to 12–13% by FY28 as manufacturing and distribution mature. Debt/equity improves to 1.5x. P/E multiple stays elevated because of renewable sector visibility and government backing.
Bear Case (₹200–₹240): Mundra restart delayed beyond FY27. ROCE stays below 10% longer. Capex continues but regulatory returns fall short. Debt breaches 2.0x D/E. Credit rating downgrade sparks sell-off. Dividend cut (currently 18.9% payout) becomes necessary.
✓ Strengths
- Vertically integrated (generation, transmission, distribution)
- Manufacturing inflection: 154% profit growth in solar
- Regulated distribution: 12.5M customers, steady cash
- Rooftop solar momentum: 1 GW in 9M, ₹324 Cr profit
- Tata Group backing (AAA-rated parent)
- Odisha turnaround: ₹800 Cr cash generation in Q3
✗ Weaknesses
- ROCE 10.8% below cost of capital (destroying value)
- Debt rising faster than equity (₹70k Cr, 1.86x D/E)
- Free cash flow negative (capex > operating cash)
- P/E 31.7x premium not justified by returns
- Mundra offline, restart terms undisclosed
- Regulatory asset accounting masks operational reality
→ Opportunities
- DCR manufacturing: structural demand from June 2026
- Mundra restart: ₹800 Cr quarterly earnings recovery
- India’s renewable target: 500+ GW by 2030
- Grid modernization: Transmission projects in pipeline
- Parallel licensing in distribution (policy shift coming)
- EV charging: 1L+ stations, early-mover advantage
⚡ Threats
- Renewable overcapacity: grid evacuation constraints
- Coal supply inflation: Mundra restart economics unclear
- Regulatory hold-up: distribution margin compression risk
- Rising interest rates: debt servicing burden
- Sector competition: Adani, Torrent gaining share
- EV charging: still unprofitable at scale
Tata Power is not a bad company. It’s a company trying to be three good companies at once and failing at the financial discipline required.
They’ve built renewable capacity faster than the grid can absorb. They’ve kept debt low enough to fund growth but high enough to limit flexibility. They’ve created manufacturing champions but embedded them in a low-ROCE utility. And they’re paying ₹376 per share—trading at 31.7x earnings—for a portfolio that earns 10.8% ROCE.
The manufacturing inflection is real. The distribution turnaround is real. But the valuation isn’t. At ₹235–₹320, Tata Power becomes interesting as a deep-value bet on capex normalization and ROCE recovery. At ₹376, it’s a market-beating growth narrative priced at perfection. And the market rarely gives perfection without exacting a price.