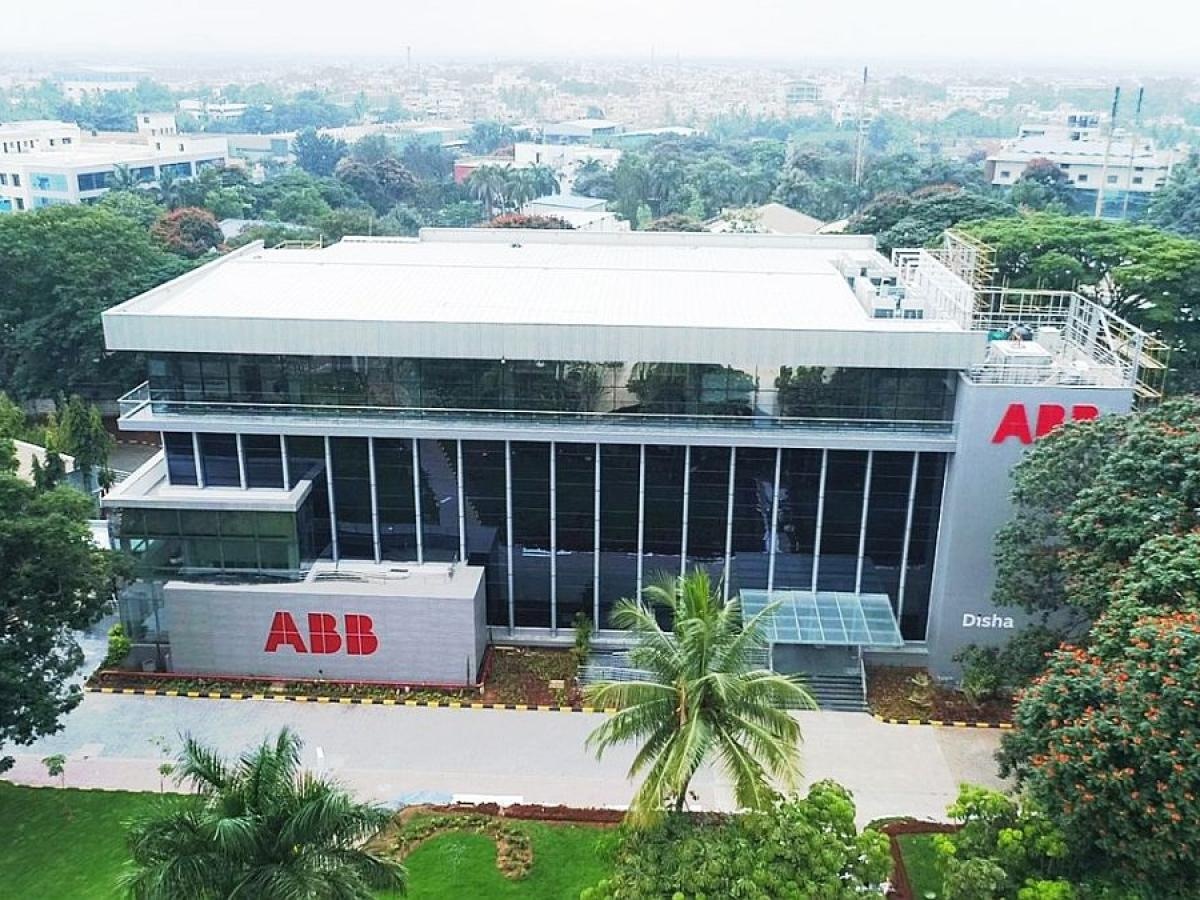
ABB India:
₹1,669 Cr PAT. 30% ROCE.
Orders Hit ₹14,115 Cr. The Electrification Play That Actually Delivers.
Highest-ever full-year revenue of ₹13,203 crore. Order book surges 52% in Q4. CRISIL gives AAA/Stable rating. Robotics division sold to Abu Dhabi’s SoftBank for $5.375 billion with ₹1,568 crore domestic transfer. This is not a speculative tech story. This is industrial India growing up.
The Transformer That Transformed India’s Industrial Base
- 52-Week High / Low₹6,300 / ₹4,590
- FY2025 Revenue (Full Year)₹13,203 Cr
- FY2025 PAT (Full Year)₹1,669 Cr
- Full-Year EPS (FY2025)₹78.73
- Q4 EPS₹20.43
- Book Value₹370
- Price to Book16.4x
- Dividend Yield0.73%
- Debt / Equity0.01x
- Order Backlog (End FY25)₹10,471 Cr
What Happens When a Global Conglomerate Decides India Is Home
ABB India is not a startup. It’s not a meme stock. It’s not even a “growth company” in the Tesla-sense. It’s a 75-year-old subsidiary of Switzerland’s ABB Ltd — a global electrification and automation behemoth with 110,000 employees worldwide. The parent company alone is a $170 billion enterprise operating in 100+ countries.
ABB India manufactures electric motors, drives, transformers, switchgear, automation systems, and industrial robots across five manufacturing locations with 25 shop floors. It reaches customers through 28 sales offices, 750+ channel partners, and exports to 30+ countries. The order book stands at ₹10,471 crore. The installed factory capacity is humming at near-full utilization. And somehow — just somehow — the stock is up 40% over 5 years and has delivered 19% CAGR for a century-old industrial manufacturer.
Here’s the plot twist: FY2025 was supposed to be complicated. The robotics division — historically 5% of revenue but growing fastest — was being demerged and sold to SoftBank’s Vision Fund for $5.375 billion globally. On February 27, 2026, 94% of shareholders approved the slump sale. Effective March 1, 2026, ABB’s robotics business became a separate entity. The core company? Even stronger on an apples-to-apples basis. Orders hit ₹14,115 crore in FY2025. Revenue grew 8%. Profit grew 57% over five years. CRISIL gave it AAA/Stable. And the market has priced in perfection.
They Electrify, Automate, and Power Everything That Doesn’t Need Gasoline
The business model is deceptively simple: India is industrializing. That industrialization requires power distribution, motor drives, automation systems, and robotics. ABB supplies all of it.
Breakdown by division (FY2025): Electrification (43%) — switchgear, distribution solutions, smart power systems for data centres, EV charging infrastructure. Motion (34%) — the world’s largest supplier of electric motors and drives, from 0.5 kW bench grinders to multi-megawatt industrial propulsion. Automation (18%) — control systems for process industries, energy, cement, metals, refineries. Post-robotics demerger, robotics was 5% but gone as of March 2026.
Revenue mix: 90% domestic, 10% export. 75% products, 14% projects, 12% services. 38% from OEMs (direct), 43% from channel partners, 10% from EPCs, 9% from end-users. This is not a hit-driven business. It’s a slow-accumulation machine with massive installed-base optionality.
When the Numbers Tell a Consistent Story
Result type: Quarterly Results | Q4 FY2025 EPS: ₹20.43 | Full-Year FY2025 EPS: ₹78.73 | Annualised EPS (Q4×4): ₹81.72
| Metric (₹ Cr) | Q4 FY25 Dec 2025 | Q4 FY24 Dec 2024 | Q3 FY25 Sep 2025 | YoY % | QoQ % |
|---|---|---|---|---|---|
| Revenue | 3,557 | 3,365 | 3,311 | +5.7% | +7.4% |
| EBITDA | 546 | 657 | 500 | -16.9% | +9.2% |
| EBITDA % | 15.4% | 19.5% | 15.1% | -410 bps | +30 bps |
| PAT | 434 | 532 | 409 | -18.4% | +6.1% |
| EPS (₹) | 20.43 | 25.10 | 19.30 | -18.6% | +5.9% |
What’s This Company Actually Worth?
Method 1: P/E Based (Post-Robotics)
FY2025 full-year EPS = ₹78.73. Historical P/E range = 18x–24x for quality industrial leaders. ABB’s 5-year profit CAGR of 57% and ROCE of 30% justify premium to sector median (19x). Fair P/E band: 20x–26x.
Range: ₹1,575 – ₹2,047
Method 2: EV/EBITDA Based
FY2025 EBITDA = ₹2,043 Cr. Current EV = ₹1,22,709 Cr → EV/EBITDA = 60.1x. Post-robotics demerger, standalone EBITDA marginally improves. Quality industrial comps with 30%+ ROCE trade at 15x–20x EBITDA. Given order visibility and backlog, 16x–20x is justified.
EBITDA range (16x–20x): ₹32,688 Cr – ₹40,860 Cr → Per share:
Range: ₹1,540 – ₹1,925
Method 3: DCF Based
Base FCF: ₹1,220 Cr (FY2025 operating CF). Growth: 8–10% for 5 years (in line with orders trajectory). Terminal growth: 4%. WACC: 9.5% (risk-free rate 6.5% + risk premium 3%, leveraged by zero net debt).
→ Terminal Value (4% growth / 5.5% cap rate): ~₹32,150 Cr
→ Total EV: ~₹38,040 Cr (zero net debt)
Range: ₹1,360 – ₹1,790
The Three-Act Play of FY2025 Drama
🤖 Act 1: The Robotics Demerger (The Strategic Move)
October 2025: ABB announced sale of its global Robotics division to SoftBank Vision Fund for $5.375 billion (pre-tax gain ₹2,400+ crore). February 27, 2026: ABB India shareholders approved slump sale of domestic robotics business to ABB Robotics India Pvt Ltd for ₹1,568.20 crore. Effective March 1, 2026. The rationale? Pure-play robotics investors get a dedicated equity story. ABB India becomes a sharper industrial electrification and automation play without robotics drag. The transaction erases ₹1,568 crore capital tied up. New company gets clean P&L.
✅ Orders & Backlog Surge
- • FY2025 Orders: ₹14,115 crore (+8% YoY)
- • Q4 Orders: ₹4,096 crore (+52% YoY)
- • Order Backlog: ₹10,471 crore (+12% YoY)
- • Backlog-to-Revenue: 0.79x (healthy execution)
- • Sectors driving: Data centres, Railways, Renewables
⚠️ Customs Penalties & Material Headwinds
- • Feb 24: Customs penalty ₹8.01 crore + ₹9.00 crore redemption fine
- • Sep 17: CGST penalty ₹72.57 lakh (FY2019-20 to FY2021-22)
- • Dec 30: Karnataka DCCT GST penalty ₹32.07 lakh
- • QCO (Quality Control Order): Imports surge, raw material costs up
- • FX drag: INR depreciation vs CHF/EUR; hedging helps partially
Nil Debt. ₹5,694 Crore Cash. Zero Leverage Anxiety.
| Item (₹ Cr) | FY22 | FY23 | FY24 | FY25 (Latest) |
|---|---|---|---|---|
| Total Assets | 9,318 | 11,001 | 12,391 | 13,638 |
| Net Worth (Eq + Reserves) | 4,939 | 5,944 | 7,075 | 7,836 |
| Borrowings | 33 | 49 | 52 | 85 |
| Cash Balance | 4,991 | 5,390 | 5,390 | 5,694 |
| Net Debt Position | 4,958 | 5,341 | 5,338 | 5,609 |
₹5,694 crore cash on books. Operating CF ₹1,220 crore in FY2025. Capex only ₹200–300 crore annually. You could run this company for 4+ years on cash alone without earning a single rupee. The parent owns 75%; management is optionality-rich.
Borrowings ₹85 crore against ₹1,28,459 crore market cap. Debt-to-equity = 0.01x. Interest coverage = 113x. The CFO literally cannot make financial risk a conversation. This is institutional financial health.
May 2025: Board approved ₹140 crore capex for LV motor capacity (23% expansion by 2029). IE5 motors launched Sep 2025. Expansion happens at zero financial risk. Capacity fills orders. Orders fill backlog. Backlog converts to cash.
Money In > Money Out. Every Single Year.
| Cash Flow (₹ Cr) | FY22 | FY23 | FY24 | FY25 |
|---|---|---|---|---|
| Operating CF | +742 | +1,351 | +1,332 | +1,220 |
| Investing CF | +1,826 | -3,352 | -503 | +363 |
| Financing CF | -140 | -269 | -770 | -966 |
| Net Cash Flow | +2,428 | -2,270 | +59 | +617 |
Financial Health Card: A+. Valuation Card: F.
5 Years of Revenue Expanding, Margins Wandering
| Metric (₹ Cr) | FY21 | FY22 | FY23 | FY24 | FY25 |
|---|---|---|---|---|---|
| Revenue | 6,934 | 8,568 | 10,447 | 12,188 | 13,203 |
| EBITDA | 1,659 | 1,497 | 2,311 | 2,513 | 2,043 |
| EBITDA % | 24% | 17.5% | 22.1% | 20.6% | 15.5% |
| PAT | 520 | 1,016 | 1,242 | 1,874 | 1,669 |
| EPS (₹) | 24.53 | 47.96 | 58.61 | 88.33 | 78.73 |
Here’s the tension: Revenue grew 18% CAGR, but EBITDA margins compressed from 24% (FY21) to 15.5% (FY25). FY2025 saw custom duties drag, labour costs spike, and forex headwinds. The market sees this as temporary. Margins will recover to 18–20% once robotics demerger settles and capex cycle normalizes. Wager: yes, possible. Bet your house on it: risky.
ABB vs Siemens vs Hitachi Energy vs BHEL: The Cage Match
| Company | Revenue (₹Cr) | PAT (₹Cr) | P/E | ROCE % | Div Yield % |
|---|---|---|---|---|---|
| ABB India | 13,203 | 1,669 | 77.0x | 29.9% | 0.73% |
| Siemens | 17,337 | 1,635 | 71.2x | 15.8% | 0.37% |
| Hitachi Energy | 7,277 | 882 | 130.7x | 19.4% | 0.02% |
| CG Power & Ind | 11,729 | 1,113 | 101.3x | 37.5% | 0.18% |
| BHEL | 30,465 | 814 | 110.7x | 4.9% | 0.19% |
The entire industrial electrification and automation sector is in a valuation bubble. ABB is not the worst. BHEL at 110x P/E with 4.9% ROCE is actually criminal. ABB, Siemens, and Hitachi Energy are all 70–130x P/E with single-digit dividend yields. This is not a value play for any investor in this peer set.
Who Owns This? Mostly the Parent. Slightly Everyone Else.
- Promoters (ABB Ltd via ABB Asea Brown Boveri)75.00%
- Public8.20%
- DIIs (LIC 3.03%, others)9.15%
- FIIs7.64%
Pledge: 0.00%. Shareholders: 2,00,657 (Dec 2025 end) — majority retail India betting on electrification. This is not a minority squeeze play. This is 75% parent control, 25% retail India euphoria.
Promoter: ABB Ltd, Switzerland 🇨🇭
140-year-old global electrification and automation giant. 110,000 employees. €32 billion revenue. S&P credit rating: A/Stable. Owns 75% of ABB India. Provides centralized R&D, brand, technology, and management oversight. ABB Ltd’s strategic play: India is one of three emerging markets (India, China, Brazil) where electrification CAGR will be 8%+ for the next decade. ABB India is not a standalone company. It’s a jewel in a global empire.
LIC Holds 3.03% 🏛️
India’s insurance behemoth holds 3.03% directly. Countless LIC-backed funds hold another 6–7%. This means every ₹1,000 crore in LIC insurance premiums indirectly participates in ABB India’s equity upside. Your life insurance is now a leveraged bet on India’s electrification. Congratulations. You didn’t even know you were a growth investor.
Auditors Love This. Regulators Sleep Well.
✅ The Gold Standard
- ✓ CRISIL AAA/Stable rating (Dec 2025) — reaffirmed
- ✓ 140 years of operating history with no structural defaults
- ✓ Board 50% independent directors, 50% woman directors
- ✓ Clean audit history — zero material qualifications
- ✓ Interest coverage 113x — leverage is literally zero
- ✓ Dividend payout 50% — disciplined, not greedy
- ✓ ISO 45001 certified safety systems across all factories
⚠️ The Wrinkles
- ⚠ Customs duty penalties (Feb 2026: ₹8.01 crore + ₹9 crore fine)
- ⚠ Quality Control Order (QCO) driving import surge, raw material cost inflation
- ⚠ GST disputes with tax authorities (pending appeals)
- ⚠ Forex volatility exposure due to 50%+ import bill denominated in CHF/EUR
- ⚠ Robotics demerger creates short-term execution noise (transition through March 2026)
India’s Industrial Electrification — Real Story or Investor Mania?
🔌 The Tailwinds (All Real)
India is industrializing at the fastest pace in three decades. Government capex is ₹12.2 lakh crore (FY2026-27, +11.5% YoY). Semiconductors, lithium-ion batteries, data centres, renewable energy, railways, smart grids — all require massive electrification. ABB’s addressable market is expanding. The Purvodaya (East Coast Industrial Corridor) alone will demand tens of thousands of MW capacity. Free Trade Agreement with EU (effective late 2026 / early 2027) will reduce tariffs on electrical products to near-zero. Competition will intensify, but demand will grow faster.
💡 The Data Centre Bet
India is building out hyperscale data centres at 5 GW+ capacity annually. Each megawatt needs modular electrical infrastructure, UPS systems, automation controls, backup systems. ABB has captured 10+ major data centre projects (Jio, Google, AWS, Microsoft, Meta). Management guidance: data centres will drive 15–20% order growth annually for the next 5 years. This is real, not VC hype.
⚡ The Renewables Momentum
India’s renewable capacity addition target: 500+ GW by 2030 (from 200 GW today). Each MW of solar/wind requires inverters, converters, transmission equipment, grid integration tech. ABB has orders from NTPC, state utilities, and private renewables players. The backlog is real. The ratios are healthy. This segment alone could deliver 12% organic CAGR.
🚨 The Competition & Margin Squeeze
Siemens operates with higher ROCE (15.8% vs ABB’s 30%) but also runs leaner gross margins due to competition. Hitachi Energy has global scale but is at 19.4% ROCE. CG Power & Industrial Solutions has 37.5% ROCE but 1/10th the revenue. The market is consolidating around three global players (ABB, Siemens, Hitachi). Indian players (BHEL, Crompton) are being pushed upmarket. Margin compression is structural. ABB’s FY25 EBITDA margin of 15.5% might be the floor, not a trough. If custom duties stay elevated, margins could stay compressed.
Competitive dynamics: ABB dominates in motors/drives (34% of revenue) and electrification (43% of revenue). Siemens is the closest competitor but larger, slower, and German. Hitachi Energy (global spin-off) is sharp but smaller in India. BHEL has government backing but is losing market share in premium segments. Crompton Greaves is smaller but aggressive. The field is not crowded. ABB’s 75% parent ownership ensures parent support. However, price competition on bids is brutal. Customers know two dozen vendors exist. ABB’s premium is in technology and reliability, not rarity.
Macro setup: Union Budget 2026-27 allocated ₹5,000 crore per City Economic Region (Tier II/III cities), semiconductor mission allocations, textile expansions, automotive PLI scheme (₹5,940 crore). The capex cycle is real and will run for 5+ years. ABB benefits from all of it — but so does Siemens, Hitachi, and others. It’s a rising tide. The question is: does ABB gain share or just float with the tide?
The Electrification Wager
ABB India is one of India’s best-run industrial companies. 30% ROCE. 57% profit CAGR over 5 years. ₹1,220 crore annual operating cash flow. AAA/Stable credit rating. Nil debt. ₹10,471 crore order backlog. The operational story is pristine. The balance sheet is a fortress. The market opportunity (data centres, renewables, railways, semiconductors) is undeniable. And yet, the valuation at 77x P/E, 81x P/FCF, and 60x EV/EBITDA is pricing in perfection plus a margin of error in the form of aggressive growth assumptions.
FY2025 Execution: Highest-ever full-year orders (₹14,115 crore). Highest-ever full-year revenue (₹13,203 crore). Q4 orders surged 52% YoY despite margin pressure from custom duties and labour costs. Order backlog +12% YoY to ₹10,471 crore. The business is humming. Management guided for sustainable margin recovery to 18–20% range once robotics demerger settles and capex cycle normalizes. Wager: believe the management or price in continued margin compression?
The Robotics Demerger: Robotics represented 5% of revenue but was the fastest-growing segment. Sold to SoftBank’s Vision Fund for $5.375 billion globally; ₹1,568 crore domestic transfer effective March 1, 2026. Impact: ABB India becomes a cleaner electrification + motion + automation play. Negatively: loses high-growth robotics unit. Management’s thesis: core business can sustain 8–10% growth with 18–20% EBITDA margins. That’s a different growth story from the market’s current pricing.
Valuation Anchor: Fair value range ₹1,360–₹2,047 (per EduInvesting analysis using P/E, EV/EBITDA, and DCF methods). CMP ₹6,062 sits at 3x the upper bound. The market is not valuing ABB as a quality industrial company. It’s valuing ABB as a growth play with an implied 12–15% EPS CAGR for 10+ years. That’s a very different thesis. For that thesis to pan out: (1) India’s capex cycle must sustain 8–10% annually for 10 years, (2) ABB must capture consistent market share gains, (3) margins must recover and hold at 18–20%, and (4) the rupee must remain stable against INR/EUR/CHF. All four must come true. Wager size: 77x P/E.
Historical Context: ABB India’s stock CAGR over 10 years = 19%. Over 5 years = 32%. Over 1 year = 14%. Most of this return came from multiple expansion (P/E moved from 25x to 77x) and earnings growth. Further multiple expansion is unlikely. Further earnings growth of 15%+ annually is possible but not guaranteed. The market has already priced in the optionality.
✓ Strengths
- 30% ROCE — best-in-class capital efficiency in India’s industrial sector
- 75% parent ownership ensures R&D access, technology transfer, management support
- ₹10,471 crore order backlog with ₹13,203 crore annual revenue = 0.79x backlog ratio (healthy execution buffer)
- ₹5,694 crore cash, nil debt, 113x interest coverage = financial fortress
- Diversified customer base across 23 sectors (data centres, railways, renewables, chemicals, pharma, semiconductors)
- CRISIL AAA/Stable rating — institutional credibility
✗ Weaknesses
- Valuation at 77x P/E leaves zero margin for error on growth assumptions
- EBITDA margins compressed to 15.5% from 24% five years ago — structural or cyclical?
- Custom Quality Control Order (QCO) driving import surge and raw material cost inflation
- 50%+ import bill denominated in USD/CHF/EUR — forex volatility exposure
- Robotics demerger removes high-growth segment; core business growth capped at 8–10%
→ Opportunities
- Data centre explosion in India: 5 GW+ annual capacity addition. ABB is the lead supplier.
- Renewables capacity target: 500 GW by 2030. Each MW = ABB order.
- Railway electrification: 40,000+ km network. Orders pipeline ₹3,000+ crore annually.
- EU-India Free Trade Agreement (effective late 2026/early 2027): tariff elimination on electrical products. Export upside.
- Margin recovery post-QCO normalization: if customs duties normalize, EBITDA margin can revert to 18–20%.
⚡ Threats
- Custom duties regime remains uncertain; QCO could persist, keeping raw material costs elevated
- Siemens and Hitachi Energy are sharpening their India play; competition intensifying
- Rupee depreciation increases import costs; hedging provides partial cover
- Growth assumptions of 12–15% EPS CAGR embedded in 77x P/E are aggressive for a 75-year-old company
- Regulatory risks (customs penalties, GST disputes) could become more frequent
ABB India is operationally excellent. The market is operationally euphoric.
This is a company with fortress balance sheet, global parent backing, best-in-class ROCE, and a tailwind from India’s electrification boom. It deserves a premium valuation. But does it deserve 3x the premium to historical norms and to sectoral comps? The data says no. The market says yes. One of you is wrong. You have to decide which.
For income seekers: 0.73% dividend yield is pale. For growth seekers: 8–10% expected earnings growth is middling at 77x P/E. For value seekers: buying at ₹6,062 when fair value is ₹1,360–₹2,047 is a leveraged bet on perfection. Choose wisely.