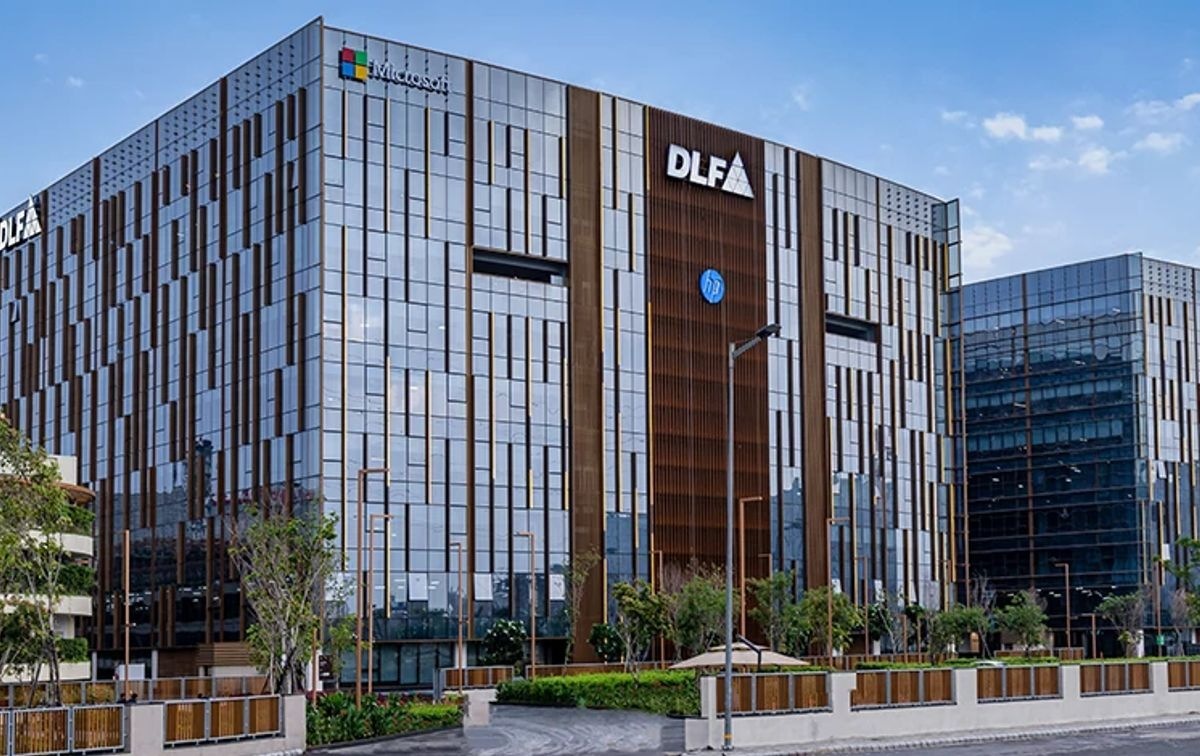
DLF Ltd:
₹1,207 Cr PAT. Zero Gross Debt.
The Biggest Indian Real Estate Bet Since The Boom.
Record collections of ₹5,100 crore in a single quarter. Development business just hit net cash. Three luxury launches selling out before they even launched. Meanwhile, the stock has fallen 13.4% in a year. The math is broken, but is it broken in your favour?
When Zero Debt Becomes a Gossip Item
- 52-Week High / Low₹888 / ₹563
- Q3 FY26 Revenue₹2,479 Cr
- Q3 FY26 PAT₹1,207 Cr
- Q3 FY26 EPS₹4.86
- Annualised EPS (Q3×4)₹19.44
- Book Value₹174
- Price to Book3.32x
- Dividend Yield1.04%
- Debt / Equity0.04x
- 1-Year Return-13.4%
If You Know Your Way to Greater Kailash, You Already Know DLF
DLF’s story is India’s urban real estate story. Since 1946, through family empires, cabinet reshuffles, three bear markets, two real estate crashes, and one Global Financial Crisis, DLF has simply continued building things. Luxurious things. High-margin things. Things that sell out in a week.
The company is structured into two neat buckets: Development (residential, commercial, retail sales) and Rental (commercial leasing through subsidiary DCCDL, the most LEED-certified real estate portfolio in the world). The duality matters because DLF Development just cracked zero gross debt while DCCDL is a cash-printing AAA-rated machine. One division is delevering. The other is compounding. Both are reporting record numbers.
Q3 FY26 delivered ₹2,479 crore in revenue, ₹1,207 crore in net profit, and collections that surprised even management itself. Two luxury projects — Privana North (₹11,000 crore sold in one week) and Westpark in Mumbai (₹2,300 crore in 416 units) — have put the company back on the nation’s real estate highlight reel. And yet, the market is pricing all of this at 33.2x P/E as if the company’s best days were already consumed by 2008.
This is a deep dive into a company that’s caught between being a historic land-rich brand and a modern capital-efficient machine. Between NCR dependence and national expansion dreams. Between cautious management philosophy and a constituency that keeps buying out entire launches before site visits.
Half Landbank Monetizer. Half Commercial Real Estate Trust.
DLF operates as a two-division company separated by one critical fact: one needs constant capital recycling; the other doesn’t.
Development Business: Identify land. Design residential and commercial projects. Sell them. Recover ₹billions through construction-linked payment plans. Repeat. The company has developed 180+ projects covering 351 million square feet. The landbank is worth a fortune on paper (₹80,000 crore+ in pipeline value) and costs almost nothing because most was acquired decades ago at colonial-era prices. Margins sit at 50–60% on a project-level basis, but reported PAT margins are lower because the company is increasingly selective and finishes projects early. Q3 FY26 showed 48% gross margins on development sales.
Rental Business: Through subsidiary DCCDL, DLF owns ~40–49 million square feet of commercial leasing space across cyber parks, tech SEZs, retail, and now data centres. DCCDL is rated AAA by credit agencies, has occupancy rates at 93–98%, and generates ₹5,900 crore in annual rental income. This is not a volatile business. It’s a slow-compounding cash-generating organism that pays dividends back to DLF.
The current portfolio is 84% NCR-dependent (that’s a soft ballpoint in ICRA’s commentary). But management is launching in Mumbai, Goa, Chandigarh, and soon Kolkata. New sales bookings have swung from ₹7,273 crore (FY22) to ₹20,438 crore (Dec 2023 data), implying that residential is the growth engine while rental is the stability anchor.
Q3 FY26: The Numbers That Shocked Management (Pleasantly)
Result type: Quarterly Results | Q3 FY26 EPS: ₹4.86 | Annualised EPS (Q3×4): ₹19.44 | Previous FY25 Full-Year EPS: ₹17.64
| Metric (₹ Cr) | Q3 FY26 Dec 2025 | Q3 FY25 Dec 2024 | Q2 FY26 Sep 2025 | YoY % | QoQ % |
|---|---|---|---|---|---|
| Revenue | 2,479 | 1,729 | 1,975 | +43.3% | +25.5% |
| Operating Profit (EBITDA) | 848 | 610 | 689 | +39.0% | +23.1% |
| EBITDA Margin % | 34% | 35% | 35% | -100 bps | -100 bps |
| PAT (Reported) | 1,207 | 1,059 | 1,180 | +13.9% | +2.3% |
| EPS (₹) | 4.86 | 4.28 | 4.77 | +13.6% | +1.9% |
Can a Company Trading at 33.2x P/E Ever Be Called “Fair”?
Method 1: Blended P/E Approach
Annualised EPS (Q3×4) = ₹19.44. Industry median P/E for real estate = 26.3x. DLF’s historical premium: 1.2–1.35x sector (due to landbank + rental stability + execution track record). Fair P/E band: 28x–35x.
Range: ₹545 – ₹680
Method 2: EV/EBITDA Based
TTM EBITDA = ₹2,016 crore. Current EV = ₹1,42,557 crore → EV/EBITDA = 70.7x (extremely high). Real estate developer comps typically trade at 8x–15x EBITDA. This metric suggests DLF is either severely overvalued OR the denominator (EBITDA) is understated due to project timing and construction accounting.
Adjusted for higher development EBITDA visibility (₹3,000–3,500 Cr estimate):
Range: ₹450 – ₹620
Method 3: Net Asset Value (NAV)
Landbank value at conservative ₹1,000/sq ft: ₹1,92,000 crore. DCCDL investment at market cap (~₹100,000 crore estimated). Cash: ₹11,600 crore (though ₹10,400 Cr trapped in RERA). Debt: ₹1,777 crore (Sept 2025). Gross NAV ~₹3,02,000 crore ÷ 248 crore shares.
Conservative: ₹1,000/sqft landbank + DCCDL stake at 0.8x NAV
≈ ₹900–1,000 per share
Range: ₹500 – ₹900
CMP ₹578 sits at the lower-middle of the NAV-adjusted range but at the high end of the P/E method. The valuation is simultaneously “fair if you believe in landbank monetization” and “expensive if you don’t.”
The Gossip Column of Indian Real Estate
🟢 The Momentum Monsoon: Back-to-Back Sellouts
Privana North (June 2025): ₹11,000 crore sold in one week. The Westpark, Mumbai (July 2025): 416 units, ₹2,300 crore in 3 months — market entry executed with precision. Dahlias (resumed Jan 2026): 25% price appreciation YoY, still selling at accelerated pace. This isn’t luck. This is execution on steroids. The question is whether the next 10 years of launches can replicate this velocity.
✅ Zero Debt in Development
- • Development business at gross debt = 0
- • Achieved ahead of management schedule
- • Collections of ₹5,100 Cr in Q3 alone (record)
- • Net cash position: ₹11,600 Cr (though 90% in RERA)
- • ICRA upgraded to AA+ (stable)
⚠️ Capital Deployment Bottleneck
- • RERA cash lock-up: ₹10,400 Cr (untouchable until FY27/28)
- • Management explicitly said “meaningful cash questions later”
- • Limits near-term dividend growth and buybacks
- • The Primus legal case (Supreme Court inquiry, 624 apartments)
- • Kolkata IT SEZ sale at ₹693 Cr closed (Feb 2025)
The Fortress That Keeps Getting Stronger
| Item (₹ Cr) | Mar 2023 | Mar 2024 | Mar 2025 | Sep 2025 (Latest) |
|---|---|---|---|---|
| Total Assets | 52,572 | 59,069 | 68,472 | 68,940 |
| Equity + Reserves | 37,687 | 39,431 | 42,550 | 42,507 |
| Borrowings | 3,334 | 4,834 | 4,103 | 1,777 |
| Other Liabilities | 11,551 | 14,804 | 21,819 | 24,161 |
| Total Liabilities | 52,572 | 59,069 | 68,472 | 68,940 |
Gross debt: ₹4,103 Cr (Mar 2025) → ₹1,777 Cr (Sep 2025). That’s a 57% reduction in six months. The deleveraging machine is humming at maximum RPM.
“Other Liabilities” at ₹24,161 Cr represents largely RERA customer advances — money already collected but earmarked for construction. This is both a liability and proof of pre-sales velocity.
Equity at ₹42,507 Cr on total assets of ₹68,940 Cr = 61.6% equity-to-assets. This is pristine capital structure. No financial engineering needed.
Collections Are Now the Lead Indicator
| Cash Flow (₹ Cr) | FY23 | FY24 | FY25 | 9M FY26 |
|---|---|---|---|---|
| Operating Cash Flow | 2,375 | 2,539 | 5,235 | 10,216 |
| Investing Cash Flow | -461 | -1,529 | -3,475 | Construction spend |
| Financing Cash Flow | -2,013 | 177 | -2,403 | Debt repayment |
| Collections (9M FY26) | ₹10,216 Cr | |||
Why a Real Estate Company’s ROCE of 6.51% Doesn’t Tell the Full Story
Annual Trends — FY23 to FY26 YTD
| Metric (₹ Cr) | FY23 | FY24 | FY25 | 9M FY26 |
|---|---|---|---|---|
| Revenue | 5,695 | 6,427 | 7,994 | 6,522 |
| Operating Profit (EBITDA) | 1,726 | 2,124 | 2,109 | 2,159 |
| EBITDA Margin % | 30% | 33% | 26% | 33% |
| Net Profit | 2,034 | 2,724 | 4,367 | 4,429 |
| EPS (₹) | 8.22 | 11.02 | 17.64 | 17.89 (TTM basis) |
This is not a growth story. This is a re-rating story. DLF is the same landowner, the same execution machine — just with more pre-sales velocity and lower debt.
DLF vs The Competition (Some of It Overheated, Some of It Overpriced)
| Company | CMP (₹) | P/E | MCap (₹ Cr) | Qtr Profit (₹ Cr) | ROCE % |
|---|---|---|---|---|---|
| DLF Ltd | 578 | 33.2x | 1,42,962 | 1,207 | 6.51% |
| Lodha Developers | 889 | 26.6x | 88,826 | 958 | 15.62% |
| Prestige Estates | 1,336 | 59.3x | 57,524 | 245 | 7.66% |
| Phoenix Mills | 1,604 | 51.9x | 57,357 | 366 | 10.75% |
| Oberoi Realty | 1,475 | 23.8x | 53,617 | 640 | 17.73% |
Sector median P/E: 26.3x. DLF at 33.2x commands a 26% premium. Lodha at 26.6x is a near-median peer with higher ROCE (15.62% vs 6.51%). Prestige and Phoenix are pure froth. Oberoi balances premium valuation with premium ROCE. DLF’s valuation is justified only if execution and landbank monetization accelerate beyond current trajectory.
Who Owns The Largest Land-Locked Real Estate Fortune in India?
Latest as of Dec 2025: Promoter holding steady at 74.08%, FIIs 14.82%, DIIs 5.78%, Public 5.34% (shares outstanding: 248.36 crore)
Promoters: The Singh Dynasty
Rajdhani Investments & Agencies (61.53%): the Kushal Pal Singh holding company. Prem Traders LLP, Mallika Housing, Raisina Agencies, Jhandewalan Ancillaries: all family-controlled entities. 74.08% in the hands of the extended Singh family. Kushal Pal Singh founded DLF in 1946. His heirs own it today. Zero pledges. Zero drama.
Institutional Ownership
- FIIs14.82%
- DIIs (LIC + MFs)5.78%
- Public Shareholders5.34%
- Total Float25.92%
Shareholder Base Expansion
- No. of Shareholders4.92 Lakh
- Change (2yr)+1.6x
- Promoter Pledges0.00%
- Retail ParticipationGrowing
Rating Upgrades and Structural Improvements
✅ The Cleaner
- ✓ ICRA upgraded to AA+ (stable) in Dec 2025
- ✓ CRISIL upgraded prior quarter; DCCDL now AAA
- ✓ Credit profile: consolidated gross debt down to ₹1,777 Cr (from ₹4,103 Cr in Mar 2025)
- ✓ Leverage (gross debt/CFO): <0.4x as of Sep 2025
- ✓ Zero gross debt in development business
- ✓ Interest coverage: 12.0x (rock solid)
- ✓ NCLT approved 16-subsidiary amalgamation (Jan 2026)
⚠️ The Complications
- ⚠ The Primus project: Supreme Court interim order directs inquiry (624 apartments, Feb 2026)
- ⚠ Material contingent liabilities still exist (despite settlement under vivad se vishwas)
- ⚠ Concentration: H1 FY26 saw 2 projects (Privana North, Westpark) contribute 80%+ of pre-sales
- ⚠ NCR dependence: 84% of H1 FY26 sales from NCR region
- ⚠ RERA cash lock-up: 90% of cash trapped until FY27/28
Bottom Line on Governance: Credit agencies believe in DLF’s de-leveraging story. The company is executing structural improvements (subsidiary mergers, debt reduction, collections scaling). But the Primus case and NCR concentration are risks to monitor in real-time.
Indian Real Estate: The Eternal Cycle of Boom, Scandal, Regulation, Repeat
The Indian residential real estate market is growing at 10–15% annually by value, not volume. That means fewer units, higher prices. COVID killed the sales pitch of “affordable housing.” Today’s game is luxury or nothing. DLF, Lodha, Prestige, Oberoi, and Phoenix are all chasing the same affluent buyer pool — which, at scale, is finite.
Macro headwinds: Interest rates remain elevated. EMI burden for a ₹1 crore property at 8.5% is ₹76,000 per month — before property taxes and maintenance. This works only for ultra-HNIs, NRIs, and real estate investors. The mass-market residential segment is depressed. DLF abandoned it. Most mid-segment players are bleeding. Only the premium end is seeing velocity.
Regulatory tailwind: RERA has brought transparency and buyer confidence. That’s why projects are selling in weeks now. But RERA also traps cash in escrow accounts, which limits developer flexibility — a hidden cost nobody prices in.
🌟 The Tailwind: NRI Money Repatriates Home
DLF noted that ~25% of Privana North sales came from NRIs and overseas remittances. Indians working in the Gulf, US, and Singapore are buying second homes for retirement or kids’ education. This is a 10-year tailwind that hasn’t even started. NCR benefits especially because of proximity to Delhi airport and Connaught Place heritage.
🏗️ The Structural Shift: Data Centres & Industrial Sheds
DCCDL is pivoting toward data centre leasing. DLF has commissioning Data Centre 3 in Noida. Global cloud companies are setting up Indian infrastructure hubs. Rental yields on data centres are 7–9% (vs 5–6% for corporate offices). This is a margin and stability upgrade that’s not yet reflected in analyst models.
🏪 The Retail Reset: Shopping Malls Are Back
Predicted dead by e-commerce in 2019, shopping malls are staging a comeback. DLF’s retail portfolio (Midtown Plaza, Summit Plaza, Mall of India, Promenade) is leasing out at 97–98% occupancy. High street brands are preferring physical DLF retail over standalone stores. Rental margins on retail are 60%+. The malls story is being ignored by equity analysts.
🌍 The Headwind: Mumbai Still Eludes DLF
With Westpark’s launch in Jul 2025, DLF finally has a material presence in Mumbai. But competitors (Lodha, Oberoi, Prestige) have 20+ years of brand equity there. Mumbai’s price per sq ft (~₹1.5–3 lakh) is 30–40% higher than NCR. Margins are squeezed. Land acquisition is 5–10x more expensive than Gurgaon. Westpark’s success is brilliant execution on a limited platform. Scaling to ₹20,000+ crore annual sales in Mumbai will take years.
Competitive Position: DLF’s 180+ projects and 351 MSF developed area is unmatched. But market share in new launches is fragmented. DLF’s advantage is landbank depth and DCCDL’s annuity income. Weakness is NCR over-concentration. Opportunity is data centre scaling, retail momentum, and NRI demand inflows. Threat is Mumbai scalability and interest rate sensitivity at the mass-premium junction.
The Fortress That Just Got Taller
DLF is a 79-year-old landowner that accidentally became a real estate company, then became a developer, and then accidentally became a real estate investment trust (through DCCDL). It’s now executing the toughest part: scaling sales velocity without chasing volume for its own sake.
Q3 FY26 Execution: ₹2,479 crore revenue (+43% YoY), ₹1,207 crore PAT, record ₹5,100 crore collections. Development business at zero gross debt. Three luxury launches sold out in aggregate ₹20,300 crore. ICRA upgraded to AA+. This is not a “broken” story pretending to be whole. This is a whole story priced as if it’s broken.
The Paradox: A company at 33.2x P/E has still delivered only -13.4% annual returns. A company with zero debt is sitting on ₹11,600 crore in cash it can’t deploy. A company with ₹80,000+ crore in pipeline value trades at 1.35x market cap. The bottleneck isn’t execution — it’s RERA regulations, cash lock-up, and investor expectations calibrated to the next decade.
The Runway: Management guided ~₹20,000 crore annual monetization from the landbank over the next 3–4 years, with downside scenarios at ₹18,000–19,000 crore. If delivered, this implies a 3x sales expansion over 4 years. DCCDL’s rental earnings will scale from ₹5,900 crore (FY26 est) to ₹7,400–7,500 crore (FY27 est). These are conservative, executable targets — not moonshots.
Historical Context: DLF returned -13.4% in 1-year, +16.7% in 3 years, and +12.8% in 5 years. This is the financial equivalent of a high-quality bond that occasionally gets repriced. The stock has rewarded patient holders. It has punished traders.
✓ Strengths
- Zero gross debt in development business
- ₹80,000+ Cr landbank, largely fully-paid
- DCCDL: AAA-rated, ₹5,900 Cr rental income, 93%+ occupancy
- Recent launches (Privana, Westpark) selling at 25%+ premium YoY
- Collections velocity accelerating (9M at ₹10,216 Cr, +21% YoY)
- Management philosophy: margin + cash over volume chasing
✗ Weaknesses
- ROCE of 6.51% (though land-accounting distorted)
- P/E of 33.2x leaves no margin of safety
- Dividend yield of 1.04% (low for a cash-generating business)
- Leadership churn risk not yet visible, but execution depends on stability
- RERA cash lock-up: ₹10,400 Cr untouchable until FY27/28
→ Opportunities
- Data centre scaling (Noida DC3 commencing soon)
- Mumbai market penetration (Westpark just beginning)
- Retail portfolio (3 major malls launching FY27, >97% pre-leased)
- NRI inflows (25% of luxury sales already sourced overseas)
- IREO land parcel (7.5–8 MSF optionality, ₹27–28k Cr GDV)
- Kolkata IT SEZ sale (₹693 Cr closed, validates non-core monetization)
⚡ Threats
- NCR market concentration (84% of H1 FY26 sales)
- Project concentration (2 launches = 80%+ of pre-sales)
- Interest rate sensitivity (EMI affordability at 8.5%+ rates)
- The Primus legal case (Supreme Court inquiry, timing unclear)
- Mumbai scalability (land costs 5–10x Gurgaon levels)
- Execution risk: 40+ MSF under construction requires contractor discipline
DLF is the rare company that’s simultaneously well-run and overpriced, with a long-term story that’s real and a near-term catalyst that’s stalled.
Zero debt is a milestone. Record collections are a milestone. Luxury pre-sales at 25% YoY premiums are a milestone. But none of these change the fact that a real estate stock trades on sentiment, and sentiment is cyclical. At 33.2x P/E, DLF has priced in the next five years of optimistic execution. Stumble once on any project, and the stock will repriced harshly.
For income-seekers: The 1.04% dividend yield is unsatisfying relative to fixed income alternatives. For capital appreciators: Wait for a 15–20% correction to entry, or wait for RERA cash unlock (FY27/28) to drive capital deployment re-rating. For existing holders: The landbank thesis is intact. The execution is solid. Patience is being rewarded over 3–5 year horizons. But don’t expect 20% annual returns. This company prints 10–12% annually on capital deployed, and the market is finally pricing that reality.