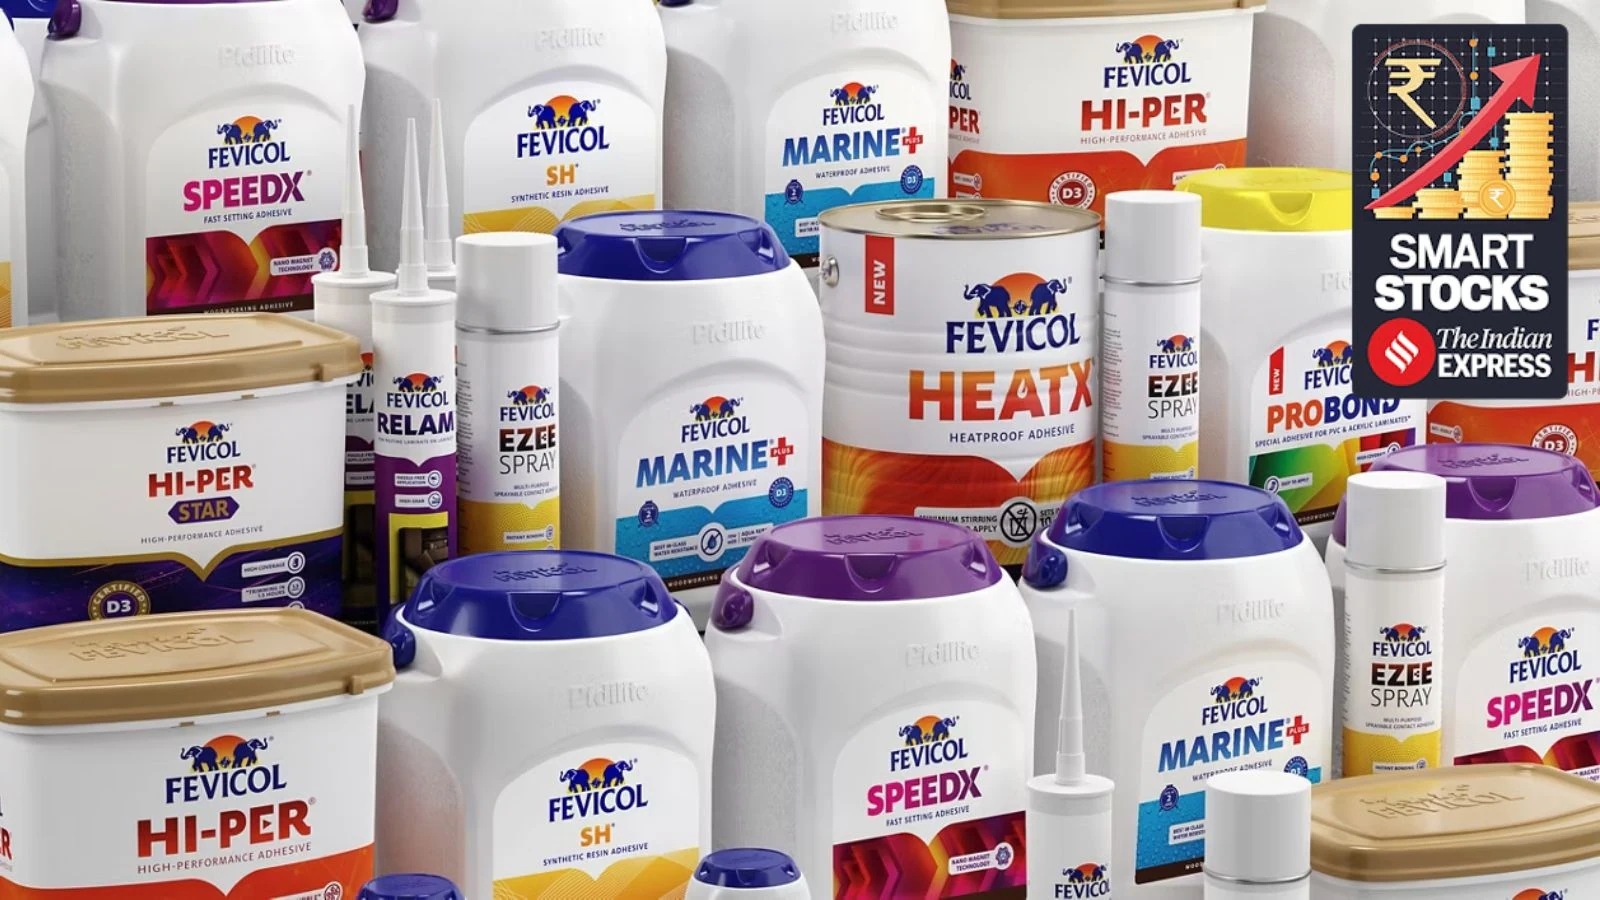
Pidilite Industries:
₹678 Cr PAT. 30% ROCE.
Fevicol Still Sticking Around. (Literally.)
Domestic volume growth at 11%. Exports getting hammered by U.S. tariffs and geopolitical chaos. Management says the pain is “largely behind us.” Markets bet they’re right. Or they’re about to find out.
The Stick-Everything Company That Trades Like a Tech IPO
- 52-Week High / Low₹1,575 / ₹1,343
- TTM Revenue₹14,159 Cr
- TTM PAT₹2,314 Cr
- Trailing EPS₹22.5
- Q3 EPS₹6.07
- Book Value₹93.9
- Price to Book15.27x
- Dividend Yield0.70%
- Debt / Equity0.05x
- Q3 UVG (Domestic)11.0%
Fevicol: The Brand That Refuses to Come Unstuck From Your Portfolio
Let’s meet Pidilite Industries. The company that taught a entire nation that you can stick anything to anything — and in the process, stuck itself to become the default choice in adhesives, waterproofing, and construction chemicals. When you walk into a hardware store, you don’t ask for adhesive. You ask for Fevicol. That’s not marketing. That’s genericide — the good kind, where the brand name becomes the category itself.
Pidilite is the market leader in domestic adhesives with ~70% market share. That’s not second place territory. That’s “we are the market” territory. Beyond adhesives, they’ve built an empire: construction chemicals (Roff, Dr. Fixit), craft materials (Fevicryl), industrial adhesives, pigments, and enough sub-brands to fill a shelf at three different shops. They operate 33 manufacturing plants across India and have a distribution network that reaches 5,050 distributors and 200,000+ retail outlets.
Q3 FY26 delivered the usual: domestic volume growth at 11%, consolidated revenue at ₹3,710 crore (+10.1% QoQ), and PAT of ₹624 crore. All solid. Except — and this is the uncomfortable bit — global exports got slapped by U.S. tariffs on pigments. Management says this was “the harshest quarter” for exports and believes the pain is “largely behind us.” Time will tell if that optimism is well-earned or just hopeful CFO-speak.
On the valuation front, the stock trades at 63x P/E. For perspective: Infosys trades at 27x, TCS at 31x. Pidilite is being valued like a tech growth story. The question is whether a 9–10% growth company in adhesives and construction chemicals deserves a 63x multiple. Spoiler: the maths gets interesting fast.
Adhesives, Chemicals, and the Art of Making Things Permanent
Pidilite’s business breaks into two parts: Consumer & Bazaar (C&B) at ~80% of revenue, and Business-to-Business (B2B) at ~20%. Within C&B, adhesives and sealants account for 53% of revenues. Construction chemicals (waterproofing, tile adhesives, flooring) add another 20%. Art & craft, industrial resins, pigments, and others fill out the remaining 27%.
The beauty of this model is simplicity wrapped in execution. Fevicol adhesive doesn’t need distribution innovation — it sits on every hardware store counter in India. Roff waterproofing benefits from India’s construction boom. Tile adhesives are growing in double digits because vertical tiling (unlike flooring) is an unskilled labour game and tile adhesive reduces failure risk. The growth stories are real. The growth multiples, however, are another discussion.
Manufacturing happens across 33 plants in Maharashtra, Gujarat, Himachal Pradesh, Assam, and Andhra Pradesh. The company has been on a capex spree — they’ve invested ~₹800 crores in the last two years and completed 15 capacity projects out of a planned 29. Distribution reaches 5,050 primary dealers (PSDs) and 200,000+ downstream outlets. That’s deeper than most FMCG companies. When your growth is driven by penetration in tier-3 and rural India, that reach is non-negotiable.
Q3 FY26: The Numbers on the Table
Result type: Quarterly Results | Q3 EPS: ₹6.07 | Annualised EPS (Q3×4): ₹24.28 | Trailing 12M EPS: ₹22.52
| Metric (₹ Cr) | Q3 FY26 Dec 2025 | Q3 FY25 Dec 2024 | Q2 FY26 Sep 2025 | YoY % | QoQ % |
|---|---|---|---|---|---|
| Consolidated Revenue | 3,710 | 3,369 | 3,554 | +10.1% | +4.4% |
| Operating Profit | 894 | 798 | 850 | +12.0% | +5.2% |
| OPM % | 24% | 24% | 24% | — | — |
| PAT | 624 | 557 | 585 | +12.0% | +6.7% |
| EPS (₹) | 6.07 | 5.43 | 5.69 | +11.8% | +6.7% |
Is Pidilite Worth ₹1,434? Or Should You Just Buy an Index Fund?
Method 1: P/E Based
TTM EPS = ₹22.52. Sector median P/E (specialty chemicals) = ~26x. Pidilite’s justified premium for brand moat + market share: 1.8x–2.1x sector. Fair P/E band: 47x–55x. (Already trading at 63x = stretched.)
Range: ₹1,058 – ₹1,238
Method 2: EV/EBITDA Based
TTM EBITDA = ₹3,317 Cr. Current EV = ₹1,46,097 Cr → EV/EBITDA = 44.1x. Quality specialty chemical comps (with moat) trade at 25x–35x. Pidilite’s premium justified but not at 44x.
EV range (28x–38x): ₹92,876 Cr – ₹126,046 Cr → Per share (assuming ₹443 Cr debt):
Range: ₹905 – ₹1,234
Method 3: DCF Based
Base FCF (approx): ₹2,200 Cr. Growth: 9–10% for 5 years, declining to 5% terminal. WACC: 10.5%.
→ Terminal Value (5% growth / 5.5% cap rate): ~₹98,200 Cr
→ Total EV: ~₹110,000 Cr (debt-adjusted: ~₹109,557 Cr)
Range: ₹1,074 – ₹1,289
Tariff Wars, CEO Changes, and Why Management Keeps Saying “It’s Behind Us”
🔴 The Export Bloodbath: U.S. Tariffs Hammered Pigment Sales
Q3 FY26 saw Pidilite’s pigment exports to the U.S. take a beating due to tariff escalations and geopolitical uncertainty. Management termed Q3 as “the harshest quarter” for exports, with secondary exposure through B2B chemicals supplied to export-linked industries (footwear, leather, textiles) also affected. Consolidated export revenue fell sharply. However, management signaled that the drag is “largely behind us,” contingent on tariff rate changes and new market development plans (“plan Bs”). Expect some recovery in Q4 FY26 and Q1 FY27, though broader geopolitical uncertainty (Russia–Ukraine, Middle East, Iran) remains a wildcard.
⚠️ Leadership Transition Underway
- • MD Sudhanshu Vats appointed 1 Apr 2025 (new MD, replacing existing).
- • Whole Time Director Joseph Varghese resigned, effective 31 Jul 2025.
- • CHRO Rahul Gama resigned, last day 31 Jan 2026; Ashish Prasad (IIM Ahmedabad, 28+ yrs exp) appointed Nov 2025.
- • Feb 2026: Ami Parikh named President–Legal, Rajesh Joshi as CBO–New Businesses.
- Multiple senior changes in one quarter. Watch for execution continuity.
✅ Growth Bets & Expansion
- • Roff positioned as “next big brand” — holistic branding including mass media + cricket.
- • Haisha Paints expanded to eastern states; steady progress but scaling questions persist.
- • Electronics adhesives: expanding into automotive; long cycles (12–18 mo per spec).
- • Waterproofing growing ahead of market through retail + projects dual-engine model.
- • Tile adhesives: high double-digit growth driven by cement substitution penetration.
Almost Debt-Free. Almost Completely Out of Money for Dividends.
| Item (₹ Cr) | Mar 2023 | Mar 2024 | Mar 2025 | Sep 2025 (Latest) |
|---|---|---|---|---|
| Total Assets | 10,505 | 12,076 | 13,984 | 13,898 |
| Net Worth (Eq + Reserves) | 7,161 | 8,356 | 9,704 | 9,452 |
| Borrowings | 391 | 382 | 454 | 443 |
| Other Liabilities | 2,902 | 3,286 | 3,775 | 3,901 |
| Total Liabilities | 10,505 | 12,076 | 13,984 | 13,898 |
Net worth grew from ₹8,356 Cr (Mar 2024) to ₹9,704 Cr (Mar 2025), though it dipped slightly to ₹9,452 Cr (Sep 2025). Debt stayed pinned at ₹443 Cr. Debt-to-equity: 0.05x. CRISIL rates them AAA/Stable. Textbook financial strength.
The company invested ~₹800 Cr in FY25 and is burning ~₹650-760 Cr annually on capacity projects. They’re not empire-building. They’re methodically expanding to serve market share gains without leverage.
Unencumbered liquid surplus: ₹3,474 Cr (as of Mar 2025). Working capital days: 19 (a dramatic improvement from 40 in Mar 2024). Cash generation is robust. Dividend payout is 46.6%, which is mild for a business of this profile.
Printing Money. Literally. Then Returning It.
| Cash Flow (₹ Cr) | Mar 2023 | Mar 2024 | Mar 2025 |
|---|---|---|---|
| Operating CF | +1,558 | +2,724 | +2,287 |
| Investing CF | -899 | -1,769 | -1,542 |
| Financing CF | -656 | -742 | -918 |
| Net Cash Flow | +2 | +212 | -173 |
Great Business. Terrible Valuation. Or Is It?
Annual Trends — Growth That’s Real But Not Explosive
| Metric (₹ Cr) | Mar 2023 | Mar 2024 | Mar 2025 | TTM |
|---|---|---|---|---|
| Revenue | 11,799 | 12,383 | 13,140 | 14,159 |
| Operating Profit | 1,986 | 2,708 | 3,011 | 3,317 |
| OPM % | 17% | 22% | 23% | 23% |
| PAT | 1,289 | 1,747 | 2,096 | 2,314 |
| EPS (₹) | 12.52 | 17.00 | 20.41 | 22.52 |
This is the story: Pidilite grows revenues at a steady 9–10%, but operating profit grows faster (19.9% CAGR) due to operating leverage and fixed cost absorption. That’s the moat working. Whether the stock’s 63x multiple is justified by “moat compounding at 9–10% growth” is your thesis to debate.
Pidilite vs The Specialty Chemicals Club (Where It’s Alone at the Top)
| Company | Revenue (₹ Cr) | PAT (₹ Cr) | P/E | ROCE % | Growth % |
|---|---|---|---|---|---|
| Pidilite Industries | 14,159 | 2,314 | 63.0x | 29.8% | 9.8% |
| Gujarat Fluorochem | 4,852 | 667 | 53.5x | 9.9% | ~5% |
| Navin Fluorochemicals | 3,077 | 562 | 60.0x | 11.7% | ~12% |
| Deepak Nitrite | 7,946 | 542 | 38.3x | 16.3% | ~7% |
| Atul Ltd | 6,055 | 594 | 31.8x | 12.8% | ~10% |
Pidilite is the largest, fastest-growing (in ROCE terms), and trading at the highest multiple. That’s defensible leadership. But it’s also a crowded room waiting for one slip-up to reset expectations. Deepak Nitrite (38.3x) and Atul (31.8x) are cheaper and growing at similar rates.
Who Runs This Adhesive Empire?
- Promoters (Parekh Family & Entities)69.32%
- Public9.40%
- DIIs (incl. LIC 3.14%)9.21%
- FIIs12.01%
Shareholding count: 5,21,850 shareholders (up from 6,18,327 in Mar 2023). Wait, it fell? The 1:1 bonus in Sep 2025 (converting ₹1 face value to ₹2) likely re-registered smaller holdings. Pledge: 0.00% — clean.
Promoters: The Parekh Family
Pidilite was founded in 1969 by Balvant K. Parekh. Today, the company is controlled by the second and third-generation Parekhs — Narendrakumar Parekh, Madhukar Parekh, Ajay Parekh, Mrudula Parekh, and associates. Key holdings via direct stakes and family trusts. In Feb 2026, Ami Parikh was appointed President–Legal, signaling continued family involvement in governance.
1:1 Bonus in Sep 2025 👀
In a surprise move, Pidilite issued a 1:1 bonus share in Sep 2025. Share count doubled from ~51 Cr to ~102 Cr. This was a significant capital structure shift — not a dilutive event, but a signal. Usually done to improve liquidity and reset per-share metrics. Worth noting for future earnings interpretations.
Auditors Love Them. Watch the Leadership Exits.
✅ The Clean Sheet
- ✓ CRISIL AAA/Stable rating (reaffirmed Sep 2025)
- ✓ CRISIL A1+ for short-term borrowings
- ✓ Zero pledged shares (promoter holding unsecured)
- ✓ Interest coverage ratio: 58.6x (near-infinite debt servicing capability)
- ✓ Independent directors: 50% of board
- ✓ 1 woman director on board (minimal but present)
- ✓ Annual concalls maintained; transparent communication
⚠️ Watch List
- ⚠ MD Sudhanshu Vats appointed Apr 2025; first major leadership change in years
- ⚠ Whole Time Director Joseph Varghese exited (31 Jul 2025)
- ⚠ CHRO Rahul Gama exited (31 Jan 2026)
- ⚠ CBO–New Businesses (Rajesh Joshi) appointed Feb 2026 — focusing on adjacencies
- ⚠ Multiple senior exits in one quarter — transition risk on execution clarity
Adhesives, Waterproofing, and Why Construction Chemicals are Actually Interesting
India’s construction chemicals market is growing at 10–12% annually — ahead of GDP growth and ahead of cement growth. Waterproofing and tile adhesives are the twin engines, both growing in double digits because of cement substitution (quality improvement) and new construction/renovation demand. Pigments remain commoditised and volatile, exposed to U.S. tariffs and global supply chains. That’s Pidilite’s Achilles’ heel in the B2B segment.
🌍 The Export Problem: Tariffs & Geopolitics
Pigment exports to the U.S. (Pidilite’s largest export destination) faced 25–60% tariff increases in 2025. Q3 was “the harshest quarter.” Secondary exposure through B2B chemicals supplied to footwear/leather/textile exporters also bled. Management’s “plan Bs” to develop new markets and reduce U.S. dependency are being executed but will take 2–3 quarters to show impact. Geopolitical risks (Russia–Ukraine, Iran sanctions, Middle East) remain unpredictable. Export revenue likely to remain pressured until tariff clarity improves.
🏘️ Domestic Construction: Multi-Engine Growth
Pidilite’s domestic waterproofing + tile adhesives + flooring portfolio is benefiting from multiple drivers: (a) residential new construction (post-pandemic boom moderating but still healthy), (b) renovation and repair (70–75% of Pidilite’s construction portfolio), (c) government spending on infra and housing schemes, (d) rural growth from better agricultural incomes and government schemes. Management emphasized they are NOT predominantly dependent on new-build residential. This is a strength.
🎯 Tile Adhesives: Cement Substitution Story
India’s tile industry grows at 8–10% annually. Tile adhesive penetration is still low — roughly 20–25% of tiles use adhesives (vs 60–70% in developed markets). Category is growing at 18–20% CAGR. The growth is driven by vertical tiling (walls; higher failure risk with cement) and applicator/contractor education. Pidilite is gaining share through Roff and premium positioning. However, the category is price-sensitive; poor product performance could slow adoption. Risk: lower-cost competitors enter.
💡 New Bets: Haisha, Electronics, and Others
Haisha Paints (small-town/rurban paints) is in early scaling with expansion to eastern states. Electronics adhesives (consumer electronics → automotive) are specification-heavy with 12–18 month cycles. These are real optionality plays but 3–5 years away from material contribution. Management correctly sized expectations. Roff branding push (holistic: mass media + cricket) aims to create the “next Fevicol,” which is ambitious but not unrealistic given the distribution reach.
Competitive Dynamics: Fevicol is so dominant (70% market share) that direct competition is muted in adhesives. Waterproofing and tile adhesives face competition from paint companies (Asian Paints, Berger) who are diversifying into construction chemicals. But Pidilite’s depth and distribution give it a structural advantage. In pigments, global commodities like Huntsman and Kronos are threats, but Pidilite competes on cost and customization. Unorganised players exist but are fragmented.
Macro Tailwinds: GDP growth driving construction + government capex. Rural India rebound post-monsoon. Strong remittances supporting housing. Middle-class expansion and premiumisation (tile adhesive penetration rises). Counter-tailwinds: potential U.S. recession (pigment exports), monsoon volatility, RBI rate cycles affecting housing demand, input cost inflation (VAM, resins tied to crude).
The Sticky Situation
Pidilite is a high-quality compounder in a large, growing market. 70% market share in adhesives. 29.8% ROCE. ₹2,287 crore annual operating cash flow. Debt: ₹443 crore (trivial). Domestic volume growth: 11%. All of this is real. But the stock trades at 63x earnings. That’s expensive, even for a moat story.
The Case for the Current Price: Pidilite’s brand, distribution reach, and ROCE (29.8%) rival the best companies in India. Domestic growth at 11% (domestic UVG) and potential export recovery could drive 12–13% consolidated growth over 3–5 years. Operating leverage (OPM expanding from 17% to 23% over three years) suggests margin upside. Capex of ₹700–750 Cr annually is disciplined, and ROIC on invested capital is >30%. For a long-term compounder, 63x on a ₹22.52 EPS (and potential 12–13% growth) is defensible IF you believe in 10+ year holding period and dividend reinvestment.
The Case Against: A 9–10% medium-term growth company (management’s own guidance) has no business trading at 63x P/E. The sector median is 26x. Pidilite’s premium (2.4x) is aggressive. Export headwinds are real — Q3 was “the harshest quarter,” and tariffs will persist. The 1:1 bonus and leadership changes (MD, CFO-equivalent exits) add execution uncertainty. Most importantly: the stock has returned 4.2% over one year while P/E expanded from ~45x to 63x. If multiples compress back to 50x on any disappointment, you lose 20% overnight.
Historical Context: Over 10 years, Pidilite has delivered 17% CAGR in stock price (excellent). Over 5 years, it’s 11% (good). Over 1 year, it’s 4.2% (meh). The stock has given a 6.89% CAGR over 3 years. This suggests the multiple expansion cycle has peaked. Reverting to 50x P/E (still 1.9x sector median) at current earnings gives a fair value of ~₹1,125. That’s a 21% cut from here.
✓ Strengths
- 70% market share in domestic adhesives — near monopoly
- 29.8% ROCE — exceptional capital efficiency
- ₹2,287 Cr annual operating cash flow — steady generator
- Domestic UVG at 11% — real growth, not assumption
- Operating leverage: OPM expanded from 17% → 23% in 3 years
- Zero leverage: Debt ₹443 Cr on ₹14,159 Cr revenue
✗ Weaknesses
- Export volatility: Q3 was “harshest quarter” due to U.S. tariffs
- Pigments commoditised: exposed to crude, FX, global supply chains
- Multiple new adjacencies (Haisha, electronics) unproven, years away
- Leadership transitions: MD, Whole-Time Director, CHRO exits in 6 months
- Dividend yield 0.70%: very low absolute payout (though ROIC >30%)
→ Opportunities
- Waterproofing: growing 12–15% CAGR; “70–75% renovation focus” insulates from new-build cycles
- Tile adhesives: 18–20% category growth via cement substitution; penetration still low
- Roff branding: building “next Fevicol”; holistic approach (mass media + cricket)
- Export recovery: tariff situation “largely behind us”; new markets development ongoing
- Haisha Paints: small-town/rural paints penetration; eastern expansion underway
⚡ Threats
- U.S. tariffs on pigments persist (25–60% rates); secondary export exposure in B2B
- Paint companies (Asian Paints, Berger) diversifying into construction chemicals
- Input volatility: VAM (vinyl acetate monomer) spikes hurt margins; crude-linked
- Multiple expansion ceiling reached: 63x is top-of-cycle valuation
- Leadership transition execution risk during multi-quarter change window
Pidilite is a great business at a stretched price.
The adhesives moat is real. The distribution is unmatched. The cash generation is pristine. And at ₹1,150–1,200, the stock would be fairly valued as a long-term compounder. But at ₹1,434, the risk/reward has shifted. The stock is pricing in either: (a) 15%+ long-term growth (doesn’t match guidance), or (b) continued multiple expansion (already at 2.4x sector median). Both are bets, not certainties.
For long-term investors comfortable with 9–10% annual returns over 10 years, Pidilite remains a high-quality name. But it’s not a screaming bargain. Export headwinds, leadership uncertainty, and valuation stretched to the ceiling suggest waiting for a 15–20% pullback or a clearer export recovery before fresh accumulation.