Welcome to one of India’s most iconic truck and bus manufacturers, where engines roar, margins have improved to 19% OPM, profits are compounding at 54% CAGR (5 years), and yet… the balance sheet looks like it’s been eating too much leverage biryani.
Q3 FY26 revenue came in at ₹14,830 Cr with PAT at ₹862 Cr. EPS for the quarter: ₹1.38. Annualised (as per Q3 rule): average of Q1, Q2, Q3 FY26 EPS × 4 = (1.04 + 1.29 + 1.38)/3 × 4 = ₹4.81 approx.
At ₹205, that implies a forward P/E around 42–43 based on annualised FY26 run-rate. So is the market pricing in peak cycle euphoria? Or is this the start of a new commercial vehicle supercycle?
Let’s open the bonnet.
2. Introduction – Diesel, Dividends & Drama
Ashok Leyland is not some startup trying to “disrupt mobility.” It is the mobility.
Flagship of the Hinduja Group. Headquarters in Chennai. Presence in 50 countries. Trained over 8,00,000 drivers. If Indian highways had a LinkedIn, Ashok Leyland would be “Top Contributor.”
It’s India’s:
2nd largest commercial vehicle manufacturer
4th largest bus maker globally
9th largest truck manufacturer
Market share:
31% in M&HCV buses & trucks
20% in LCV
Between FY22 and FY24, commercial vehicle segment revenue grew 78%. That’s not inflation. That’s proper engine revving.
But every auto story is cyclical. When demand is strong, volumes surge, margins expand, profits explode. When cycle turns? Even ROCE forgets its own name.
So the real question: Are we at the top of the CV cycle or mid-journey?
3. Business Model – WTF Do They Even Do?
Simple. They sell moving metal.
1) Commercial Vehicles (89% of FY24 revenue)
They sell:
Trucks (2.5 to 55 tonnes)
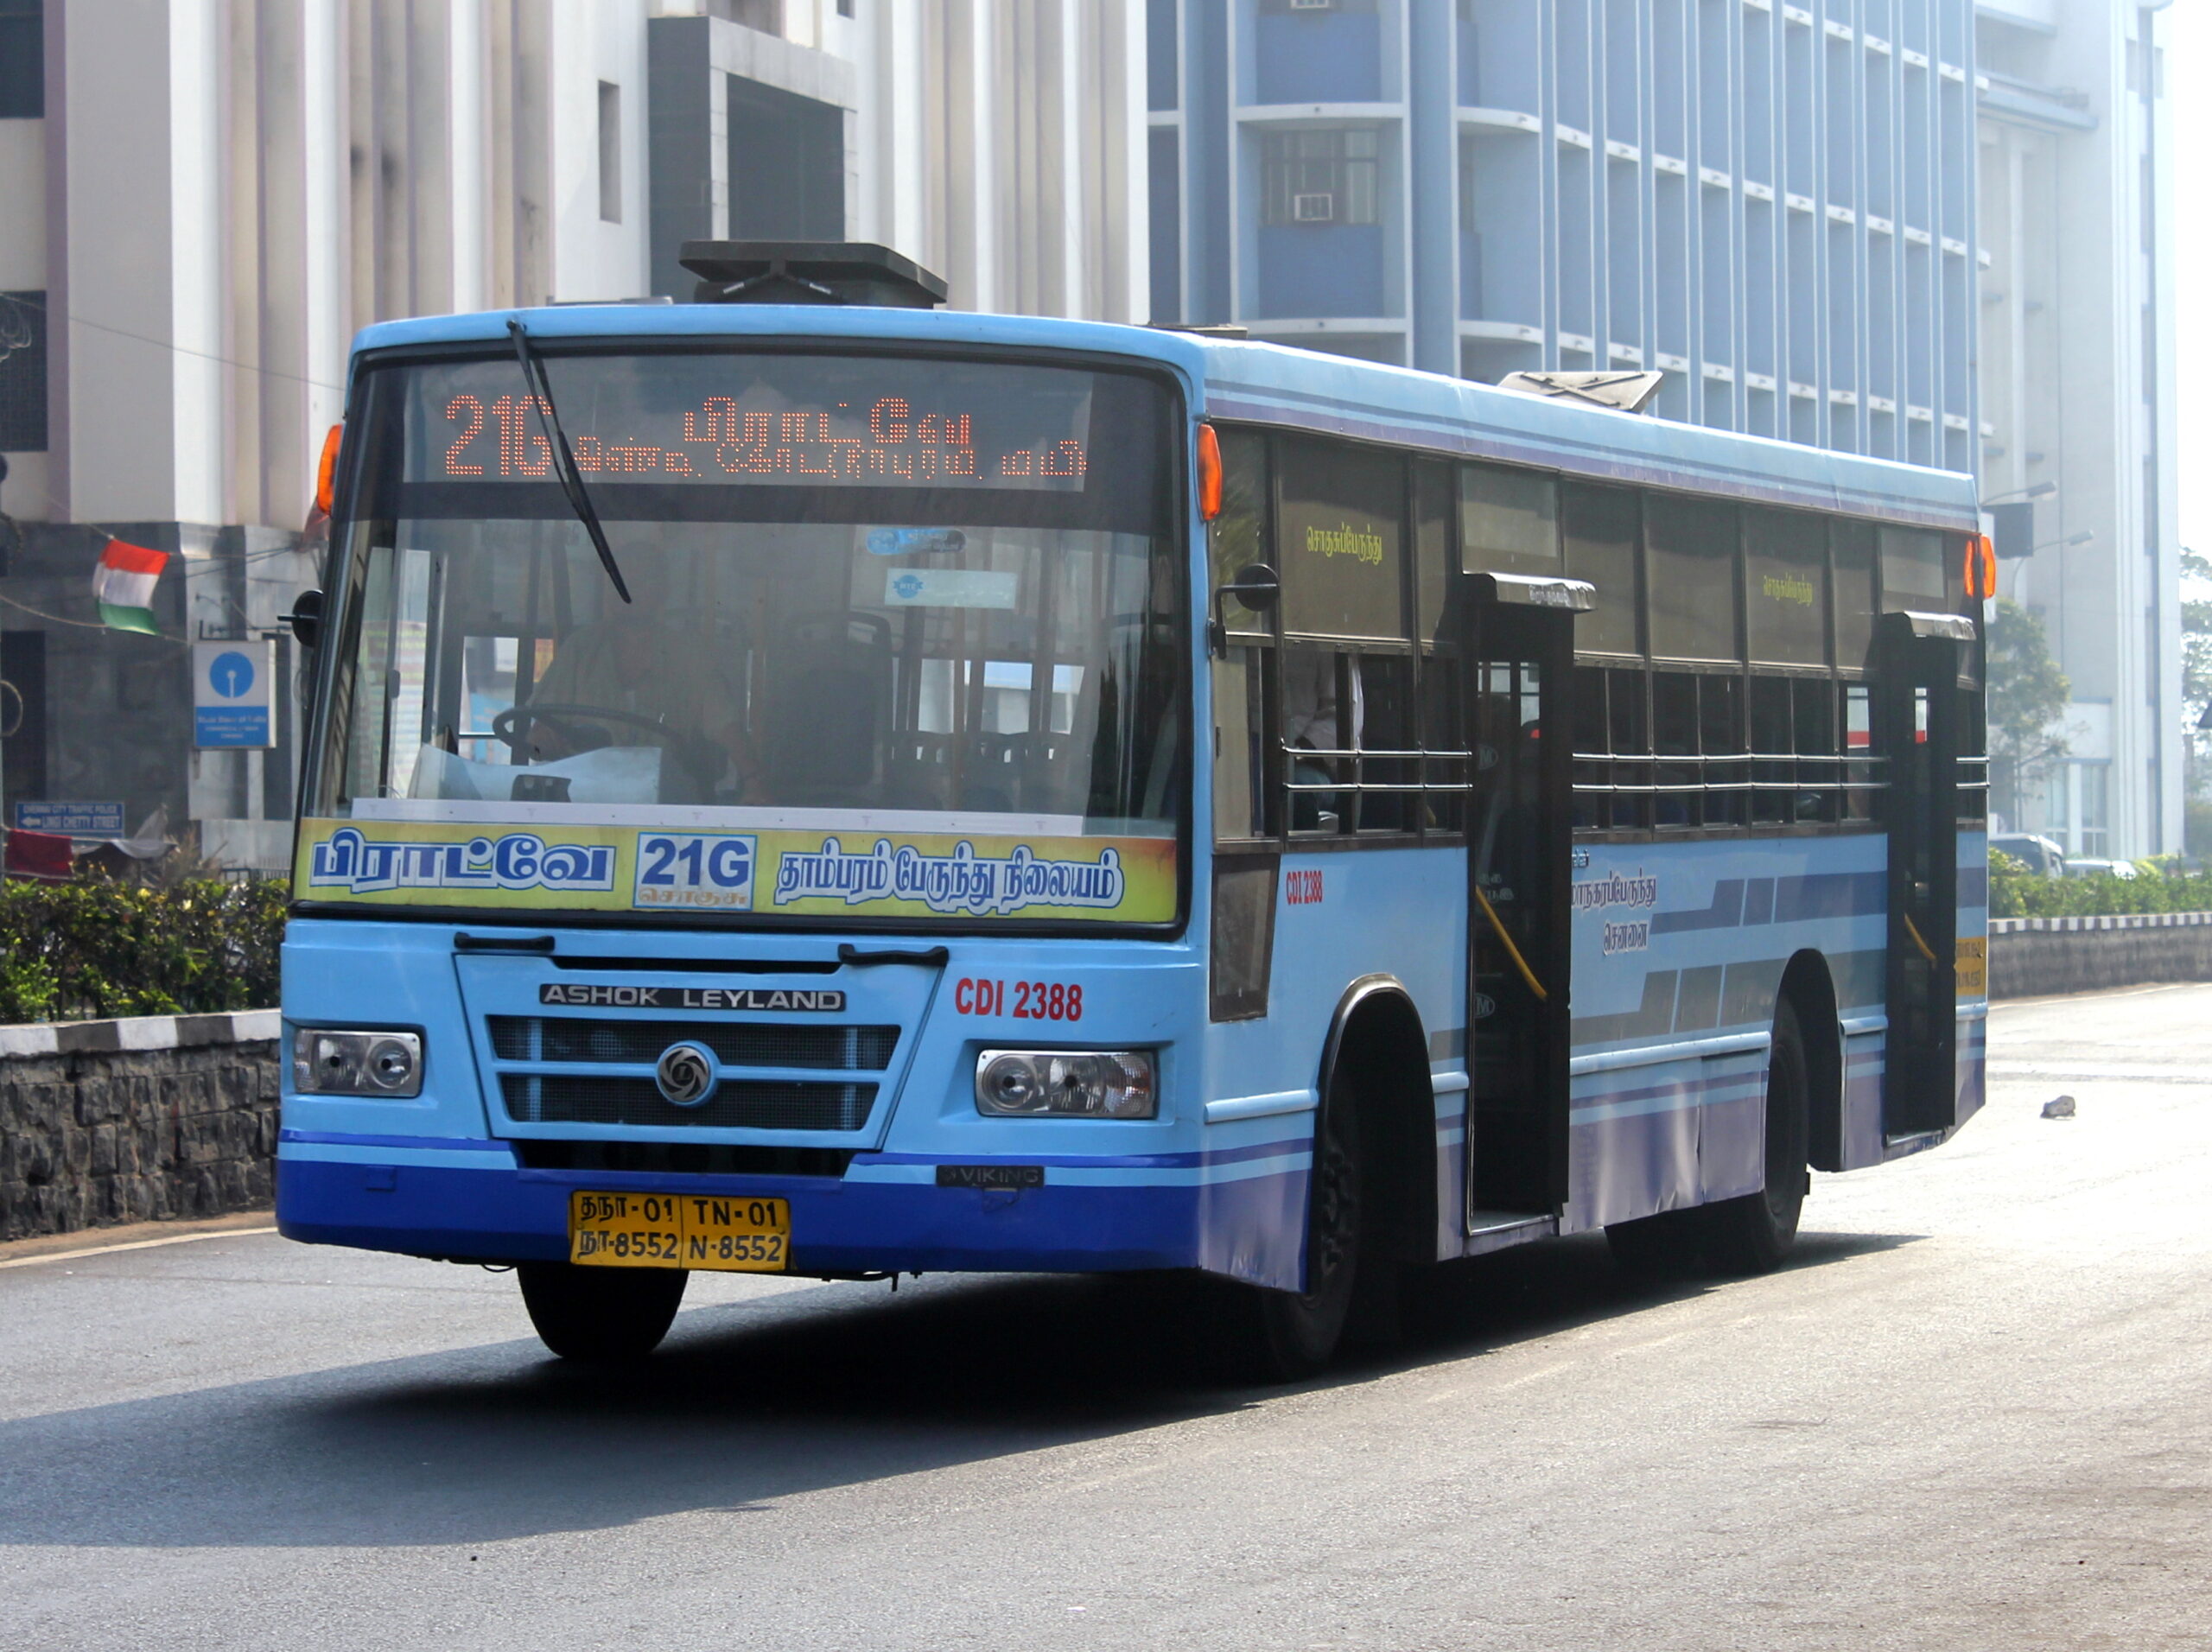
Buses (Cheetah, Viking, Lynx, Sunshine)
Defense vehicles
Engines and gensets
FY24 truck sales: 96,995 units (vs 60,947 in FY22). Bus sales: 17,956 units (vs 3,018 in FY22). LCV sales: 66,633 units (vs 52,222 in FY22).
That bus jump? From 3,018 to 17,956. That’s not growth. That’s a resurrection.
2) Financial Services (11%)
Vehicle and housing finance via subsidiaries. Grew 50% between FY22 and FY24.
Translation: They sell trucks… and also lend money so customers can buy those trucks. Smart. Vertical integration level: Marwari uncle approved.
3) Others
Power Solutions: 32,374 engines sold in FY24
Defence: 1,116 vehicles
Aftermarket: 689 stores, 2.5 lakh AL Care app users
Now think: what’s more profitable — selling trucks once, or selling spare parts for 10 years?
Exactly.
4. Financials Overview – Show Me the Diesel Money
Quarterly Results – Consolidated Figures in ₹ Crores