1. At a Glance – The ₹1.4 Lakh Crore Wiring Wizard
Samvardhana Motherson International Ltd is sitting pretty at a market cap of ₹1,40,796 crore with a stock price of ₹133. In the last 3 months alone, the stock has run up 18.5%, and in 1 year it has delivered a solid 51.8% return. Not bad for a company that sells wires, mirrors, plastics, and basically everything except the steering wheel.
Q3 FY26 revenue came in at ₹31,409 crore, PAT at ₹1,072 crore, and EPS at ₹0.97. Operating margin stands at 10%. The stock trades at a P/E of 39.8 versus industry PE of 28.1. ROCE is 13.7%, ROE is 12.2%, Debt to Equity is 0.53, and dividend yield is a polite 0.44%.
Is this a global auto components powerhouse? Absolutely.
Is it cheap? That’s where the drama begins.
Let’s open the bonnet.
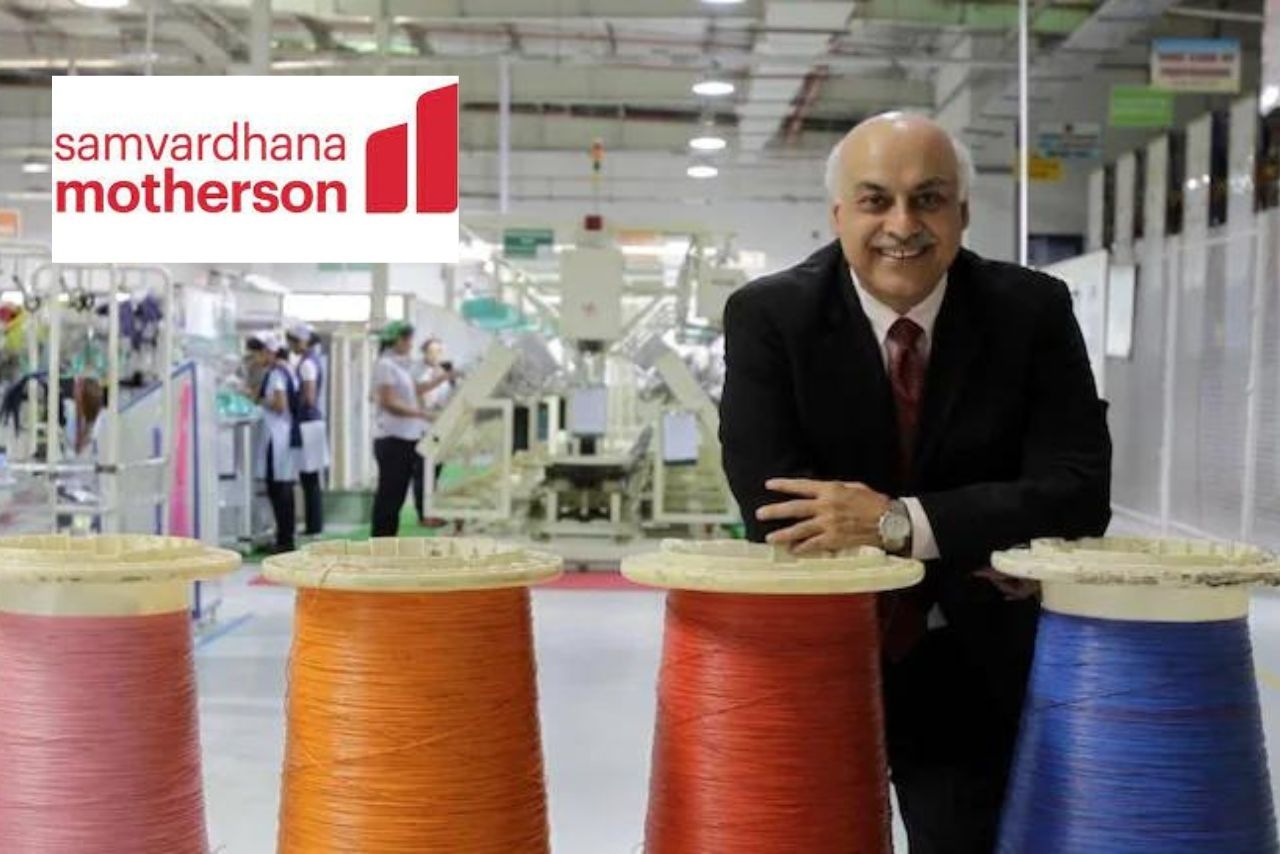
2. Introduction – From Wiring Harness to World Domination
Motherson didn’t wake up one morning and say, “Let’s become global.” It did it factory by factory, acquisition by acquisition, continent by continent.
This company is present in 270 facilities across 41 countries. That’s not expansion. That’s a passport with no blank pages left.
Revenue for TTM stands at ₹1,21,111 crore. PAT is ₹3,639 crore. That gives you a net margin of roughly 3%. Yes, 3%. Welcome to auto components — where you sweat for every rupee.
Over the last 5 years, profit CAGR stands at 26%. Over 3 years? A spicy 60%. But TTM profit growth is -15%. So what’s happening? Margin pressure? Capex binge? Acquisition indigestion?
Also, promoter holding has fallen from 64% zone to 48.6%. That’s not a rounding error. That’s meaningful dilution and restructuring impact.
The question is simple: Is Motherson a compounding machine in a temporary slowdown, or is valuation running ahead of fundamentals?
Stay with me.
3. Business Model – WTF Do They Even Do?
Imagine you build a car. You need:
- Wiring harness (nervous system)
- Mirrors (eyes)
- Polymer modules (organs)
- Metal assemblies (bones)
- Software and tech systems (brain)
Motherson supplies almost all of this.
Revenue mix FY25:
- Wiring Harness – 25%
- Vision Systems – 15%
- Modules & Polymer – 46%
- Integrated Assemblies – 8%
- Emerging Businesses – 6%
So nearly half the revenue comes