1. At a Glance – Conveyor Belts, Cash Belts, or Just Belt-Tightening?
₹1,722 per share. Market cap ₹1,868 Cr. Stock P/E 37. ROCE 22.1%. ROE 18.2%. Debt-to-equity 0.12. Dividend yield 0.29%. Three-month return: +2.26%.
Welcome to Thejo Engineering Ltd, the company that literally makes the mining industry move — conveyor belts, mill liners, rubber protection systems — basically the “knee pads” of heavy industry.
Latest Q3 FY26 numbers? Revenue at ₹162.25 Cr (up 19.7% YoY), but PAT slipped to ₹8.39 Cr (down 18.4% YoY). OPM cooled to 11.38%. So sales are sprinting, but margins look like they skipped leg day.
The stock trades at 37x earnings — higher than the industry median P/E of 29.4. Investors clearly believe this engineering specialist has more torque left in the engine.
But here’s the real question: Is this a global niche champion quietly compounding, or is the market paying Ferrari valuation for a Tata Ace gearbox?
Let’s put on the hard hat and walk into the plant.
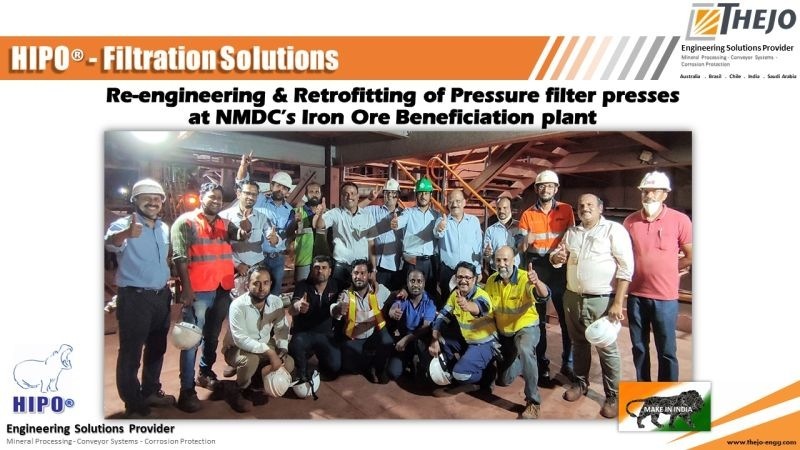
2. Introduction – The Unsung Hero of Dirty Industries
Mining. Cement. Steel. Fertilisers. Ports.
Not exactly Instagram-worthy industries. But if you’ve ever seen a conveyor belt carry iron ore like a giant treadmill for rocks, you’ve indirectly witnessed Thejo’s handiwork.
Founded in 1986, the company has positioned itself as an engineering solutions provider in bulk material handling and mineral processing. In plain English: they make sure heavy stuff moves without breaking machinery every three days.
Revenue mix FY23:
Manufacturing – 23%
Services – 70%
Others – 7%
Seventy percent from services? That’s not just selling equipment. That’s maintenance, on-site technical solutions, repeat revenue.
So this isn’t just a “sell once and forget” engineering business. It’s more like “sell, service, repeat, invoice.”
Geographically:
Domestic – 59%
Export – 41%
With subsidiaries in Australia, Saudi Arabia, Brazil, Chile, UAE — this Chennai-based company is quietly global.
But global dreams don’t excuse shrinking quarterly profits, right?
Let’s dig into what they actually do.
3. Business Model – WTF Do They Even Do?
Imagine you run a mining operation. Rocks are crashing, iron ore is grinding, conveyors are moving 24/7.
Now imagine that system failing every two weeks.
That’s where Thejo comes in.
They design and manufacture rubber and polyurethane engineered products:
Belt cleaning systems
Spillage control
Impact protection
Abrasion-resistant liners
Screening systems
Basically, they are the shock absorbers of heavy industry.
Four manufacturing facilities in Chennai. One expanded 3,10,000 sq. ft. unit inaugurated March 24, 2023. Molded product capacity boosted by 50% to 3,600 MT per annum.
Oh, and they’ve applied for 32 product patents. 19 already granted. So this isn’t just “rubber factory uncle business.”
Now the interesting twist:
They’ve been consolidating international subsidiaries:
Acquired 100% of TE Global FZ-LLC (UAE)
Increased stake in Thejo Australia to 100%
Multiple export orders from Brazil and Australia
Is this the quiet rise of a niche global engineering specialist?
Or are we seeing aggressive expansion just before margins wobble?
Let’s open the quarterly books.
4. Financials Overview – The Quarter That Confused Everyone
Metric
Latest Qtr (Dec 2025)
YoY Qtr (Dec 2024)
Prev Qtr (Sep 2025)
YoY %
QoQ %
Revenue
₹162.25 Cr
₹135.58 Cr
₹153.11 Cr
+19.67%
+5.96%
EBITDA
₹18.46 Cr
₹24.17 Cr
₹21.07 Cr
-23.64%
-12.38%
PAT
₹8.39 Cr
₹13.84 Cr
₹14.11 Cr
-39.36%
-40.54%
EPS (₹)
8.20
12.13
13.92
-32.40%
-41.09%
Now here’s the correct annualisation (Q3 rule): Average EPS (Q1, Q2, Q3 FY26) = (8.68 + 13.92 + 8.20) / 3 = 10.27 Annualised EPS = 10.27 ×