1. At a Glance
₹8,615 crore market cap. Stock at ₹5,190. Down ~11% in 3 months, ~18% in 6 months — which is ironic because the business itself is jogging at a decent pace while the stock is tying its shoelaces in public. Q3 FY26 revenue came in at ₹374 crore (+20.7% YoY), but PAT slipped 14.6% YoY to ₹77.6 crore. ROCE is a spicy 47.8%, ROE a smug 36.4%, debt is basically missing (₹6.2 crore), and dividend yield is a very real 2.41%.
This is a vitamins–minerals–supplements (VMS) cash machine with brands your parents, doctor, chemist, and neighbourhood uncle all recognize. But the stock? It’s priced like a luxury SUV in a traffic jam. Let’s open the bonnet.
2. Introduction – The Quiet OTC Emperor
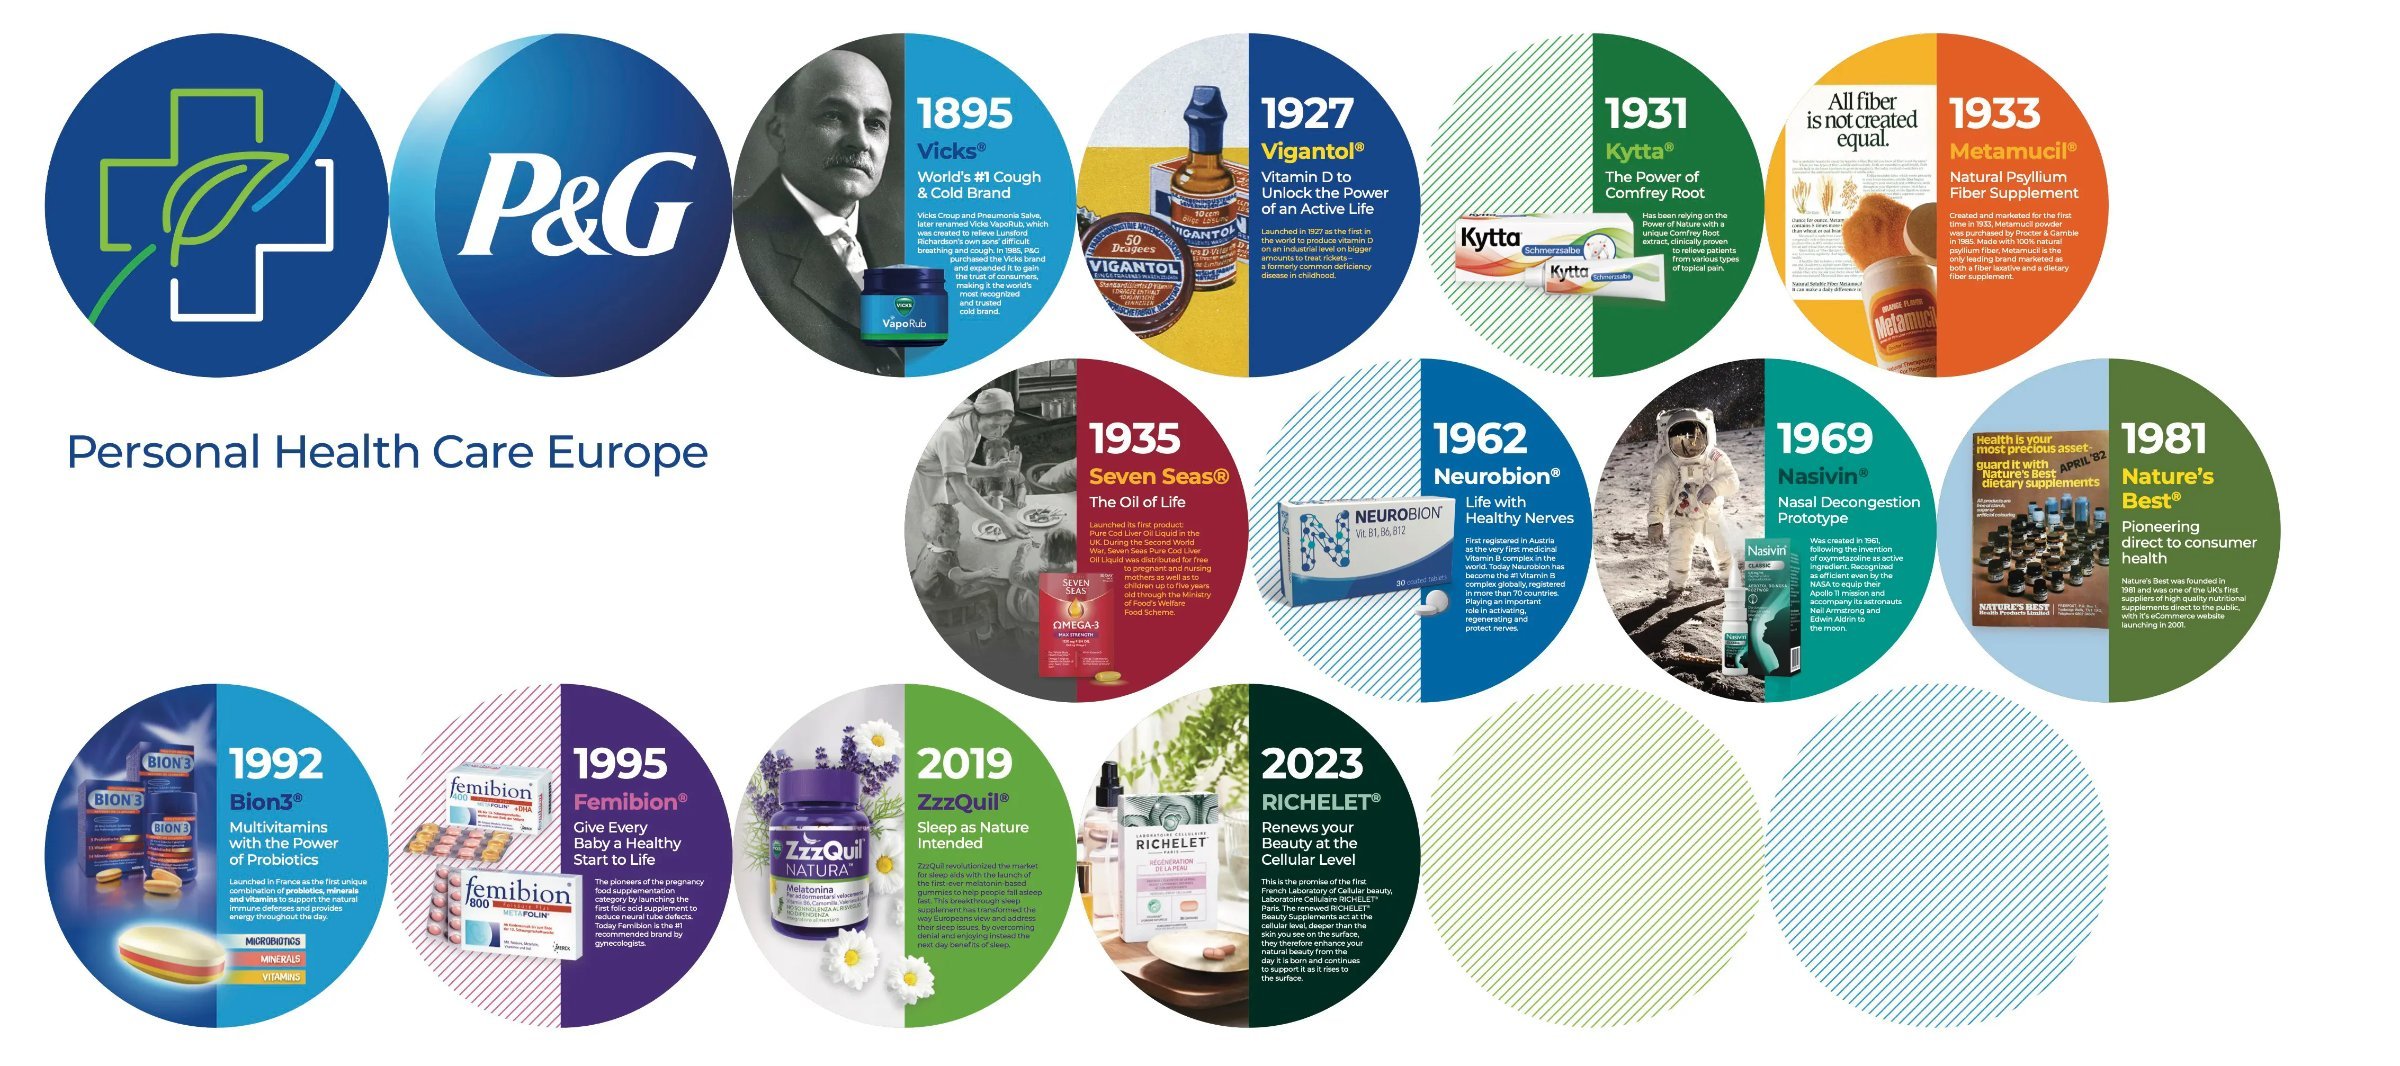
P&G Health is that rare Indian pharma company that doesn’t shout about APIs, ANDAs, USFDA inspections, or China-plus-one drama. It just sells Evion, Neurobion, Seven Seas, Livogen, Nasivion—and quietly mints money.
This is not a growth-at-any-cost startup. This is a mature, boring, dividend-spitting consumer healthcare play. The kind your CA uncle secretly loves but won’t admit on Twitter.
But here’s the twist: despite strong brands and insane returns on capital, sales growth over 5 years is basically flat. The company is profitable, disciplined, and cash-rich—but also conservative to a fault. So the big question: is this a defensive compounder… or a beautifully maintained museum?
3. Business Model – WTF Do They Even Do?
Think of P&G Health as a chemist-shop king, not a hardcore pharma innovator.
- Core focus: Vitamins, Minerals & Supplements (VMS)
- These are OTC / prescription-lite products
- Brands are decades old and doctor-recommended
- Demand is steady, repeat-driven, and recession-resistant
Manufacturing happens at one Goa plant, which