1. At a Glance – Blink and You’ll Miss It (But Don’t)
National Fittings Ltd is that classic smallcap aunty-universe stock that suddenly shows up on your Screener feed with “Qtr Profit Var +182%” and makes you spill your chai. As of early February 2026, the company sits at a market cap of roughly ₹161 crore, trading around ₹177, down about 9–10% over three months, but still up ~23% over one year.
Latest quarterly numbers? Sales of ₹23.64 crore and PAT of ₹2.93 crore for Q3 FY26. Sounds decent, right? But the real masala is that profit jump—182% YoY—which looks like a Diwali rocket on the chart. Dig deeper and you’ll notice a suspicious amount of other income doing heavy lifting in recent periods.
Valuation-wise, the stock trades at about 14.7x earnings, cheaper than the broader industrial products peer median (~19–20x). Debt is almost negligible at ₹3.77 crore, ROCE hovers near 10%, ROE at ~9%, and dividend yield is a modest 0.57%—basically one samosa per year, not a full thali.
So what’s going on here? Is this a sleepy export-focused pipe fitting manufacturer quietly compounding, or just a one-off asset sale glow-up? Let’s put on our funny-detective hat and investigate 🔍
2. Introduction – Small Company, Big Pipes, Bigger Questions
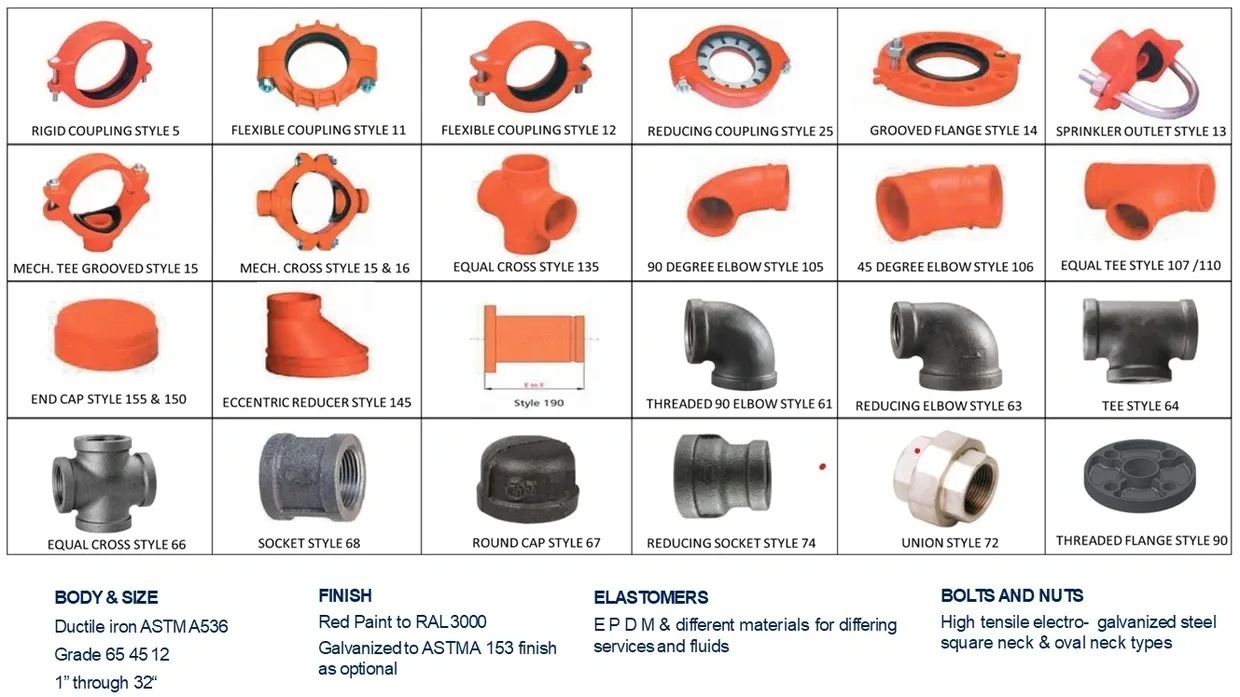
National Fittings Ltd was incorporated in 1993, long before Screener existed and before everyone started saying “microcap but scalable bro.” The company manufactures spheroidal graphite (SG) iron pipe fittings, stainless steel fittings, ball valves, and even pumps. Basically, if something needs to carry water, fluid, or pressure without bursting mid-way, these guys want a piece of that business.
The company is export-oriented, with a heavy dependence on the Middle East, which contributes roughly two-thirds of revenue, while domestic sales make up the remaining ~33% (based on FY22 geography). This immediately tells you two things:
- Forex risk exists (USD, AED, etc. matter).
- Infrastructure cycles in oil-rich regions matter more than Indian real estate mood swings.
Over the years, National Fittings has remained relatively under the radar. No flashy investor presentations. No Twitter pumpers yelling “PIPE STORY”. Just a steady manufacturing outfit with foundries, including an investment casting (lost wax) facility that supplies most of its own casting requirements.
But FY25–FY26 suddenly made the company interesting. Profits exploded, EPS jumped, debt collapsed, land got sold, promoters exited, a new promoter walked in, open offers happened, and management changed. If this were a Netflix series, this would be Season 3: “Everything Happens at Once.”
So… is this transformation sustainable, or just accounting fireworks?
3. Business Model – WTF Do They Even Do?
Imagine explaining National Fittings to a friend who thinks “fittings” means gym equipment.
National Fittings makes pipe fittings and valves—critical but boring components used in:
- Water supply systems
- Fire protection pipelines
- Industrial fluid handling
- Infrastructure and construction projects
Product Buckets (Simplified, No MBA Needed)
- SG Iron Pipe Fittings (~89% of FY22 revenue)
These are ductile iron fittings used in pipelines—stronger than