1. At a Glance – The Heat Exchanger That Learned to Fly Abroad
The Anup Engineering Ltd is what happens when a boring industrial manufacturer suddenly discovers exports, confidence, and investor love — all at once. Market cap sitting pretty at ₹4,139 Cr, stock price around ₹2,072, and a valuation that screams “premium capital goods club” with a P/E of ~35.5x.
FY25 sales clocked ₹836 Cr, operating margins stayed strong at ~22%, and ROE is a respectable 18.9%. Debt is controlled (₹158 Cr, D/E ~0.25), dividends exist (yes, rare species), and the company is no longer that sleepy Ahmedabad workshop people ignored pre-COVID.
But here’s the plot twist — Q3 FY26 profit fell YoY, even as revenues grew. Why? Execution cycles, depreciation, interest, and the joys of scaling up heavy engineering capacity. The stock meanwhile is down ~30% over one year, despite a multi-year growth story.
So the real question:
Is Anup Engineering just catching its breath… or catching valuation reality?
2. Introduction – From Arvind’s Backyard to Global Refineries
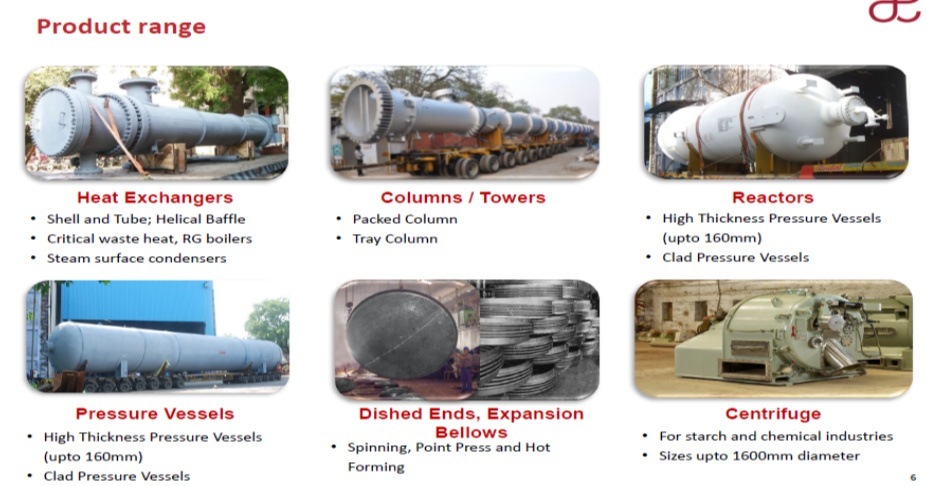
Demerged from Arvind Limited in 2018, Anup Engineering didn’t exactly come with fireworks. It came with pressure vessels, columns, and a lot of steel nobody on Twitter cared about.
Fast forward a few years — and suddenly Anup is shipping heat exchangers to global LNG, petrochemical, and hydrogen projects, with exports now forming more than half of revenues. That’s not a cosmetic shift — that’s a business model evolution.
From being India-focused (90% domestic in FY22), Anup now earns ~52% from exports (H1 FY25). That doesn’t happen without:
- Certifications
- Design capability
- Project execution discipline
- And the ability to tolerate brutal client audits
This is no longer a “make-to-print” vendor story. It’s drifting into complex engineered-to-order territory, where margins, stickiness, and reputation matter more than volume.
But with growth comes capex, working capital stress, and margin volatility. The honeymoon phase doesn’t last forever.
3. Business Model – WTF Do They Even Do?
Imagine a refinery, fertilizer plant, or LNG terminal. Now imagine all