1. At a Glance – Blink and You’ll Miss the Turnaround
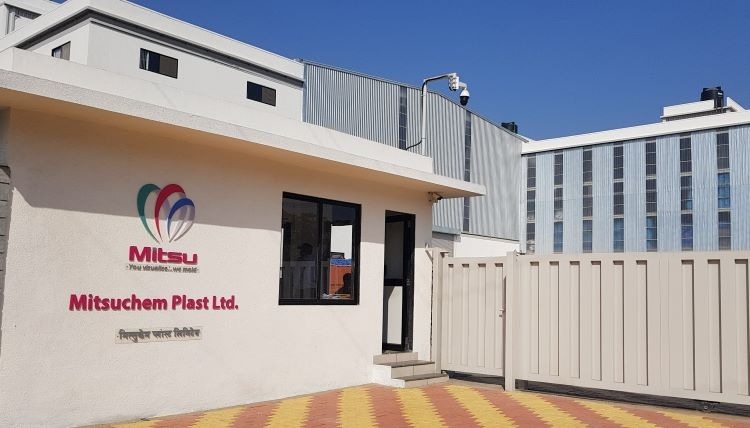
₹132 Cr market cap. Stock chilling at ~₹97, down ~15% in 6 months, while Q3 FY26 just casually dropped a 224% QoQ profit jump like it’s no big deal. Quarterly revenue at ₹86 Cr, PAT at ₹4.71 Cr, EBITDA margin jumped to 11.24%, and EPS printed ₹3.47 in a single quarter.
Promoters hold 67.8%, debt sits at ₹62.4 Cr, ROCE ~10.4% (still warming up), and valuation is sitting at ~11.4x P/E—cheap enough to raise eyebrows, not cheap enough to switch off the brain.
Exports are growing like a startup pitch deck (110–144% YoY depending on segment), healthcare furniture brand Furnastra is flexing overseas, and management is whispering a bold ₹1,000 Cr revenue dream by FY28.
Question is simple: Is this a real compounding plastic story… or just a very well-molded quarterly pop?
2. Introduction – Plastic Is Boring, Until It Isn’t
Plastic packaging companies are usually ignored like the instruction manual of a mixer grinder. Everyone uses them, nobody respects them. Mitsu Chem Plast lived in that zone for years—steady sales, okay margins, decent clients, but nothing to make Twitter threads orgasm.
Then Q3 FY26 happened.
Profits tripled. Margins expanded. Exports exploded. Suddenly this ₹130-odd Cr smallcap is showing signs of operational swagger.
But before we start dreaming of Mold-Tek level rerating fantasies, let’s slow down. Mitsu has history—good years, meh years, debt-heavy phases, margin compression, promoter dilution via rights issue. This is not a fairy tale startup; this is a 30+ year old factory-floor veteran trying to reinvent itself in a tougher, ESG-obsessed, export-hungry world.
So the real question isn’t “Can Mitsu grow?”
It’s “Can Mitsu scale profitably without choking on debt and working capital?”
3. Business Model – WTF Do They Even Do?
Think of Mitsu as the invisible supplier behind things you actually care about.
A) Industrial Packaging (86% of revenue)
Drums, containers, jars, pails, caps—blow-molded and injection-molded plastic used by chemicals, pharma, FMCG, lube oil, agrochem players.
Clients include Godrej, Tata, BASF, Cipla, Castrol, Grasim, Aarti Industries—basically companies that don’t tolerate supplier nonsense.
Margins here are okay, not sexy. Volumes matter. Efficiency matters. Raw material prices decide your mood.
B) Healthcare Furniture – Furnastra (11%)
This is where management is clearly emotionally invested.
Hospital beds, railings, CPR boards, over-bed tables—plastics that hospitals abuse daily. Exports here grew 144% YoY, with presence across Middle East, Europe, US, Japan.
Higher margin. Brand-led. Less commodity risk.
Also, more certifications, more quality headaches.
C) Custom & Infra Parts (2–3%)
Seats, caps, baby products, stadium seating—small but strategic. This is the optionality bucket.
Manufacturing capacity: ~28,000 MT per annum across Tarapur & Khalapur. Capacity additions are ongoing—small, disciplined, internally funded (music to an investor’s ears).
Lazy explanation over. Now let’s open the financial kitchen.
4. Financials Overview – Numbers Don’t Lie, But They Flirt
Quarterly Comparison (₹ Cr)
| Metric | Latest Q3 FY26 | Q3 FY25 | Q2 FY26 | YoY % | QoQ % |
|---|---|---|---|---|---|
| Revenue | 86.00 | 80.46 | 92.42 | +6.9% | -6.9% |
| EBITDA | 9.67 | 5.51 | 5.88 | +75% | +64% |
| PAT | 4.71 | 1.48 | 1.88 | +218% | +151% |
| EPS (₹) | 3.47 | 1.09 | 1.38 | +218% | +151% |
Annualised EPS (Q3 rule)
Average of Q1, Q2, Q3 FY26 EPS = (0.96 + 1.38 + 3.47) / 3 = 1.94
Annualised EPS = ₹7.76
At CMP ~₹97 → Forward P/E ~12.5x.
Not dirt cheap. Not expensive. Just… interesting.
Commentary:
Margins expanded because operating leverage + export mix + cost control. Revenue dipped QoQ but profit spiked—classic sign of quality revenue replacing junk volume.
But can this margin sustain? Or was Q3 just a festival bonus?
What do you think—new normal or one-off hero quarter?
5. Valuation Discussion – No Targets, Only Math
Method 1: P/E Range
- Industry average P/E: ~17x
- Conservative Mitsu multiple: 10–14x
- EPS (annualised): ₹7.76
Fair Value Range (P/E): ₹78 – ₹109
Method 2: EV/EBITDA
- EV: ~₹194 Cr
- EBITDA TTM: ~₹29 Cr
- EV/EBITDA: ~6.6x
Peers trade 8–12x.
Re-rating possible only if margins sustain above 10%.
Method 3: DCF (Very Mild Optimism)
- Revenue CAGR assumption: 15%
- Margin expansion to 10–11%
- WACC kept high (smallcap tax)
DCF Band overlaps ₹90–₹115 zone.
Disclaimer:
This fair value range is for educational purposes only and is not investment advice.
6. What’s Cooking – News, Triggers & Masala
- Q3 FY26: EBITDA +73%, PAT +217% – mic drop
- 655 MT capacity added, more coming
- Boisar plant expansion: ₹101 lakh capex, internally funded
- Furnastra brand launched – healthcare export play
- Exports up 110%+ in FY25 YTD
- Rights issue (FY24) cleaned balance sheet partially
Triggers are real. Execution risk is also very real.
7. Balance Sheet – Still Lifting Weights
Latest: Sep FY25 (₹ Cr)
| Item | Sep FY25 |
|---|---|
| Total Assets | 196 |
| Net Worth | 100 |
| Borrowings | 62 |
| Other Liabilities | 34 |
| Total Liabilities | 196 |
Snarky Notes:
- Debt is down from peak, but not gone
- Net worth improving post rights issue
- Balance sheet is fitter… not yet gym-bro ripped
8. Cash Flow – Sab Number Game Hai
| Year | CFO | CFI | CFF |
|---|---|---|---|
| FY23 | 22 | -27 | +3 |
| FY24 | 9 | -12 | +3 |
| FY25 | 15 | -8 | -7 |
Operating cash flow exists (good).
Capex eats cash (expected).
No reckless debt binge (thank god).
9. Ratios – Sexy or Stressy?
| Ratio | Value |
|---|---|
| ROE | 8.2% |
| ROCE | 10.4% |
| Debt/Equity | 0.62 |
| PAT Margin | 2.2% (TTM) |
| P/E | ~11.4 |
Verdict: Improving, but not elite.
This is a turnaround ratio set, not a compounder one yet.
10. P&L Breakdown – Slow Cooker, Not Microwave
| Year | Revenue | EBITDA | PAT |
|---|---|---|---|
| FY23 | 309 | 27 | 12 |
| FY24 | 311 | 26 | 9 |
| FY25 | 332 | 23 | 7 |
| TTM | 354 | 29 | 11 |
Margins compressed, then bounced.
Classic plastic cycle behavior.
11. Peer Comparison – David Among Giants
Compared to EPL, Mold-Tek, TCPL—Mitsu is tiny, lower margin, but far cheaper.
Peers have scale. Mitsu has agility.
Who wins long term—size or speed?
12. Shareholding – Promoters Still Driving
- Promoters: 67.8%
- Public: ~32%
- No pledging (huge plus)
Promoter holding dropped earlier due to rights issue—not panic selling.
13. Corporate Governance – Boring Is Good
No accounting drama.
Regular concalls.
Auditors haven’t run away.
That itself is a compliment in smallcaps.
14. Industry Roast – Plastic Isn’t Dead, It’s Just Judged
Everyone hates plastic until they need medicine, food, water, logistics.
ESG pressure is real, but recyclable, lightweight, efficient plastics are still winning.
Healthcare packaging + exports = survival kit.
Mitsu isn’t fighting giants. It’s picking niches. Smart.
15. EduInvesting Verdict – Interesting, Not Idiotic
Strengths
- Export momentum
- Margin expansion signs
- Diversification into healthcare
- Reasonable valuation
Weaknesses
- Debt still present
- ROE mediocre
- Working capital heavy
Opportunities
- Furnastra scaling
- Export-led re-rating
- Operating leverage
Threats
- Raw material volatility
- One-quarter wonder risk
- Execution fatigue
Final Thought:
Mitsu Chem Plast is no multibagger lottery ticket, but it is a serious smallcap trying to upgrade its personality.
Watch margins. Watch debt. Watch exports.
If those behave—this plastic might just shine.
Written by EduInvesting Team | Date