1. At a Glance – The Printer That Prints Cash… Except This Quarter
Control Print Ltd (CPL) is that rare Indian manufacturing species which actually dominates a niche globally ignored by Twitter finfluencers—coding & marking. Market cap around ₹1,082 Cr, current price hovering near ₹671, P/E sitting at a deceptively low ~11x, ROE flexing at ~27%, ROCE a respectable ~18.5%, and debt so low (₹7.4 Cr) that banks probably forget CPL exists.
But Q3 FY26 decided to throw a mild tantrum. Revenue grew ~15% YoY to ₹118.8 Cr, yet PAT fell 36% QoQ to ₹5.26 Cr, margins slipped, and EPS face-planted to ₹3.29. Cue panic tweets? Maybe. Cue forensic analysis? Definitely.
Is this a structural crack or just a quarterly printer jam? Let’s open the machine and check the ink levels.
2. Introduction – When Monopoly Businesses Have Bad Hair Days
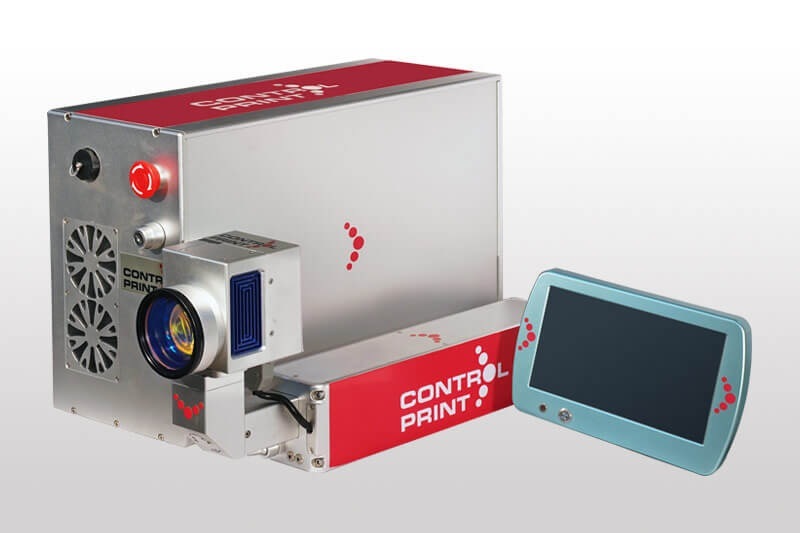
Control Print is not a flashy SaaS darling. It doesn’t sell “AI-powered synergies”. It sells printers that literally print money for FMCG, pharma, cement, cables, tyres, and anything that needs an expiry date slapped on it.
And here’s the punchline: CPL is the only coding & marking company manufacturing in India. Everyone else? Mostly importers with service arms.
Over 21,000 printers installed. Presence in 1,700+ towns, covering 2,700+ pin codes. That’s not distribution—that’s domination.
Yet Q3 FY26 shows a familiar mid-cap pattern:
- Revenue growing
- Margins wobbling
- Profits looking drunk QoQ
- Long-term trend still annoyingly strong
So the real question: Is Q3 noise… or signal?
3. Business Model – WTF Do They Even Do? (Explained Like You’re