1. At a Glance – Blink and You’ll Miss the Cash
SJS Enterprises is what happens when “stickers, badges and shiny plastic bits” quietly become a ₹5,337 crore market cap business with 29% operating margins. Q3 FY26 just dropped and it wasn’t subtle: revenue ₹2,435.3 million (+36.4% YoY), EBITDA ₹756.4 million, PAT ₹450.4 million, and net cash sitting pretty at ₹2,030.1 million. Stock trades around ₹1,668, P/E ~34x, ROCE 22.8%, debt-to-equity a laughable 0.05.
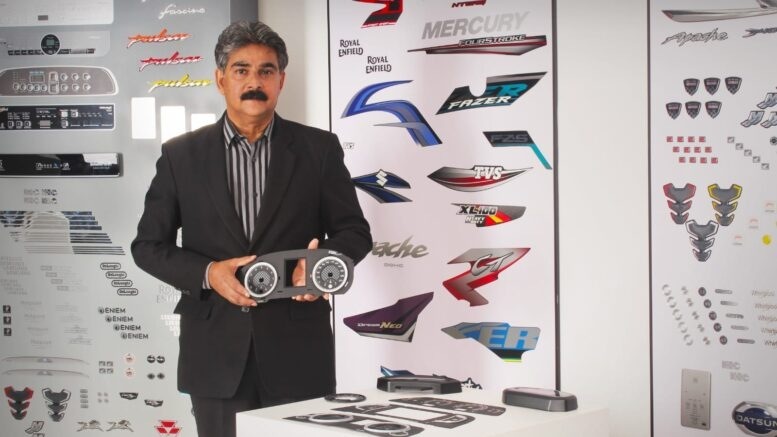
This is not a cyclical metal basher crying about steel prices. This is an aesthetics mafia supplying 6,700+ SKUs, embedded deep inside two-wheelers, cars, washing machines, and now… electronics inside plastic. Customers don’t switch easily because redesigning dashboards and badges is more painful than changing a CFO. Result? Top customers stick around for ~19 years.
Question for you: when was the last time you noticed a car logo change suppliers every year?
2. Introduction – From “Chipku” to Cash Machine
At first glance, SJS looks like a glorified sticker shop. Decals, appliques, domes, chrome-plated plastic—things your relatives think are “bas design ka kaam.” But under the hood, this is a design-to-delivery moat business.
OEMs don’t want vendors; they want partners who sit in the design room, tweak materials, manage tooling, handle surface finishing, and deliver just-in-time across factories. Once you’re inside, you’re not easily kicked out. That’s how SJS quietly built exposure across two-wheelers (45%), passenger vehicles (33%), consumer appliances (15%), with the rest sprinkled across farm equipment, medical devices, and sanitaryware.
Margins tell the real story. 27–29% OPM in an auto ancillary world where peers celebrate 12–15% like a wedding anniversary. This isn’t volume brute force; it’s precision aesthetics plus long-term relationships.
Be

2 Responses
Numbers are wrong in Table under section 4
Hey we refer to the official filing & the numbers are accurate, please let us know which is wrong?