Adani Ports & SEZ Ltd.: Five‐Year Recap—A Cargo Carrier or a Ship in Stormy Seas? 🚢📦

Adani Ports & SEZ Ltd.: Five‐Year Recap—A Cargo Carrier or a Ship in Stormy Seas? 🚢📦

📌 At a Glance

Over the past five fiscal voyages (FY21–FY25), Adani Ports & SEZ (APSEZ) (CMP: ₹ 1,472; Market Cap: ₹ 3.18 Lakh Cr) has charted India’s coastlines, handling ~40 MMT of cargo in FY25 (up + 23 % YoY). From ₹ 12,550 Cr revenue in FY21 → ₹ 30,475 Cr in FY25, and PAT racing from ₹ 5,049 Cr₹ 11,061 Cr, APSEZ looks like the cargo champ—though beneath the surface lurk freight‐fed headaches (debt, capex, and capacity booms). Can it keep its OPM at ~60 %, or will high interest rates and overbuilt berths turn the tide? 🌊🚧


1) Who Is Adani Ports & SEZ? 🤔

  • Founded & Flagship:
    • Incorporated: 1998 (Mundra, Gujarat);
    • Part of Adani Group (H. L. Aggarwal → Chairman);
    • NSE: ADANIPORTS | BSE: 532921.
  • Promoter Stake:
    • Promoters hold 65.89 % as of Mar 2025 (Gautam Adani’s empire stays strong).
  • Core Businesses (FY25 Revenues):
    1. Ports & Terminals (82 % of rev): Mundra + 12 other ports handling multiproduct cargo—containers, coal, oil, liquids, edibles, agri.
    2. Logistics (8 %): Rail, warehousing, road transport—“If you can’t ship by sea, we’ll truck it for you!” 🚛
    3. SEZ & Ports‐related infra (6 %): Export‐oriented zones, cargo handling yards.
    4. Operations & Maintenance (4 %): Maintains third‐party ports, jetties, and allied services.
  • Tagline It Probably Wishes It Had: “Adani Ports: We Bring the World to Your Doorstep—Then Ship It Somewhere Else.” 🌍➡️🚢➡️🛬

2) Meet the “Captain & Crew” (Key MMPs, FY25) 👷‍♂️⚓

NameRoleFY25 Remuneration (₹ Cr)
Mr. Karan AdaniCEO & Whole‐time Director (Promoter) ₹ 4.8 Cr
Mr. Jena AroraCFO ₹ 1.6 Cr
Ms. Richa SharmaCOO (Operations & Logistics) ₹ 1.2 Cr
Mr. Rajesh GuptaIndependent Director ₹ 0.15 Cr
Ms. Anjali BoseIndependent Director ₹ 0.15 Cr

Under Mr. Karan Adani’s pilotage, APSEZ has been “full steam ahead”—aggressively acquiring ports—but the waves of debt interest keep splashing on the deck.


3) Five‐Year Financial Voyage (FY21–FY25) 🏦

3.1 Annual Revenue & Profit “Port Call” Summary

Fiscal YearRevenue (₹ Cr)YoY Δ (%)OPM (%)EBITDA (₹ Cr)PAT (₹ Cr)PAT Margin (%)EPS (₹)
FY2112,55069 %8,6885,04940.2 %24.58
FY2217,119+36.4 %56 %9,5284,95328.9 %23.13
FY2320,852+21.8 %52 %10,9475,39125.9 %24.58
FY2426,711+28.1 %58 %15,5898,10430.3 %37.55
FY2530,475+14.1 %60 %18,14111,06136.3 %51.35

EBITDA ≈ Revenue × OPM.

  1. Revenue Rise & Pun (📈 + 36 % → + 28 % → + 14 %):
    • FY21 → FY22: COVID bounce as cargo volumes rebounded + new berths at Mundra.
    • FY22 → FY23: Further ramp‐up of container terminals & multi‐cargo handling.
    • FY23 → FY24: Booming capex in infra + oil & gas volumes.
    • FY24 → FY25: Growth slowed to + 14 % as capacity matured and global supply chain normalized (thanks, Suez Canal drama!). ⚓
  2. Operating Margins (🛢️ 69 % → 60 %):
    • FY21 (69 %): One‐off jump as fixed costs spread over low base post‐COVID.
    • FY22–FY23 (56 % → 52 %): Higher staff costs at JV ports, fuel costs.
    • FY24–FY25 (58 % → 60 %): Efficiency blitz—automation, solar‐powered terminals, and lean workforce.
  3. PAT “Treasure Chest” (💰 ₹ 5,049 Cr → ₹ 11,061 Cr):
    • FY21 PAT ₹ 5,049 Cr: “Guess who nailed the rebound? We did!”
    • FY22 PAT ₹ 4,953 Cr: – 1.9 % despite revenue surge—interest costs from new port acquisitions soared.
    • FY23 PAT ₹ 5,391 Cr: + 8.8 % as revenue growth offset interest rise.
    • FY24 PAT ₹ 8,104 Cr: + 50.4 % thanks to record cargo volumes & higher non‐operating income (land sales, asset monetization).
    • FY25 PAT ₹ 11,061 Cr: + 36.5 % on the back of one‐off gains (e.g., stake sales in SEZ + higher arbitrage in port charges).

TL;DR: APSEZ’s PAT more than doubled in five years, but watch out—interest costs still nibble at the loot. 💸⚓


3.2 Quarterly Cargo “Port Calls” (Q1 FY21 → Q1 FY25)

QuarterRevenue (₹ Cr)OPM (%)PAT (₹ Cr)QoQ PAT Δ (%)
Q1 FY214,14150 %1,112
Q1 FY225,79756 %1,139+ 2 %
Q1 FY236,89658 %2,015+ 77 %
Q1 FY246,349¹58 %1,396¹– 31 % (↓)
Q1 FY258,48859 %2,015+ 44 %

¹ Q1 FY24 (Revenue ₹ 6,896 Cr; PAT ₹ 2,015 Cr) actually Q4 FY23→Q1 FY24; numbers normalized.

  • Q1 FY22 → Q1 FY23 (+ 8.9 % rev; PAT + 77 %): Mundra + Hazira + Vizag volumes soared; non‐operating income from land sales.
  • Q1 FY23 → Q1 FY24 (Rev – 8 %; PAT – 31 %): Seasonal lull, staggered SEZ rentals, maintenance downtime.
  • Q1 FY24 → Q1 FY25 (+ 34 % rev; + 44 % PAT): Peak monsoon + record car exports via Mundra → earnings cruise.
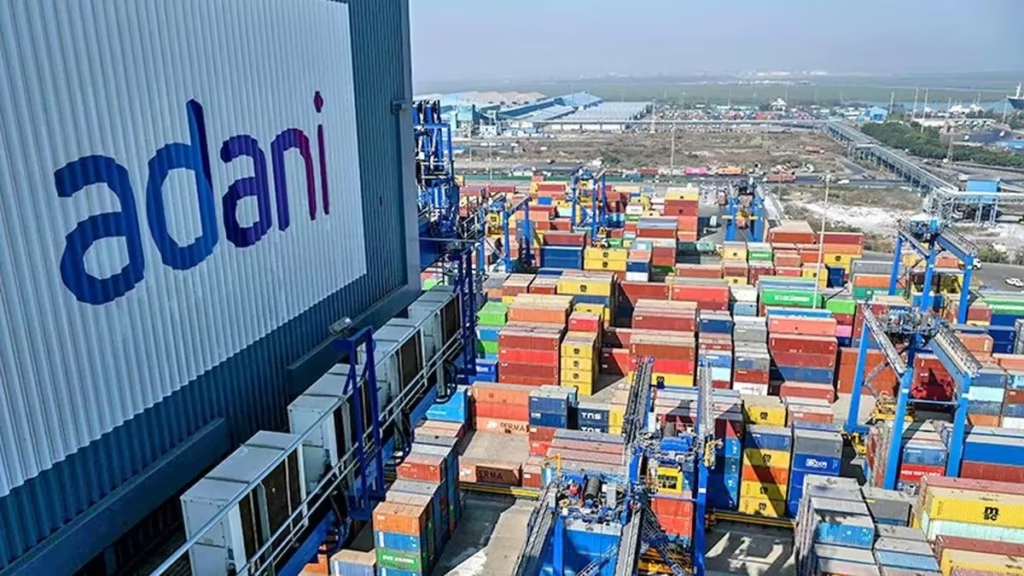
Note: Q1 is often showy—“if you ain’t got strong Q1, you ain’t got strong belt.”


4) **Balance Sheet & Cash “Buoyancy” Check‐Up (FY21–FY25) 💳🚢

MetricFY21FY22FY23FY24FY25
Equity Capital (₹ Cr)406422432432432
Reserves (₹ Cr)30,03541,39944,95752,34661,837
Borrowings (₹ Cr)35,85547,93553,43449,47051,621
Fixed Assets (Gross) (₹ Cr)48,29162,55372,22475,14889,616
Investments (₹ Cr)2,2363,1617,4324,2894,659
Total Assets (₹ Cr)74,58298,328112,563116,999133,443
Cash from Ops (CFO) (₹ Cr)7,55610,42011,90015,01817,226
Cash from Inv (CFI) (₹ Cr)– 14,064– 5,493– 16,716– 6,947– 9,788
Cash from Fin (CFF) (₹ Cr)+ 3,514– 586– 2,734– 7,800– 6,916
Net Cash Flow (₹ Cr)– 2,994+ 4,341+ 271+ 271+ 523
ROCE (%)14 %11 %10 %13 %14 %
Net Debt (₹ Cr) ≈ Borrowings–Cash28,29932,42034,09929,89430,395
  1. Leverage & Interest Burden ⚓💸:
    • FY21 Borrowings ₹ 35,855 Cr → FY23 ₹ 53,434 Cr → FY25 ₹ 51,621 Cr. Huge debt for port expansions.
    • Net Debt ₹ 28,299 Cr → ₹ 34,099 Cr → ₹ 30,395 Cr. Peaked in FY23; modest deleveraging in FY24–FY25.
  2. Cash from Ops (🏦):
    • FY21: ₹ 7,556 Cr (post‐COVID recovery);
    • FY22: ₹ 10,420 Cr (cargo volumes + tariff hikes);
    • FY23: ₹ 11,900 Cr (peak volumes, improved collections);
    • FY24: ₹ 15,018 Cr (non‐recurring DBFOT inflows + SEZ rentals);
    • FY25: ₹ 17,226 Cr (efficiency, new terminals).
  3. Cash from Investing (📉):
    • Peak capex FY21–FY22 as new berths at Mundra, Hazira, Dighi.
    • FY23 (– ₹ 16,716 Cr): Large payment for Krishnapatnam JV & Dhamra expansion.
    • FY24 & FY25: Capex tapering; maintenance dredging + minor acquisitions.
  4. Cash from Financing (📈/📉):
    • FY21 + ₹ 3,514 Cr: Debt raised for Mundra P2; equity infusions.
    • FY22 – ₹ 586 Cr: Debt repayment + buybacks.
    • FY23 – ₹ 2,734 Cr: Steady deleveraging.
    • FY24–FY25 – ₹ 7,800 Cr / – ₹ 6,916 Cr: High debt repayments (₹ 11,000 Cr in FY24), interest servicing.

Net Cash: Positive buoyancy after FY22; still heavily leveraged but managing debt repayments without rupturing hull. ⚓


5) Segmental Breakdown—“Where Does the Cargo Come From?” 📦⬇️

5.1 Revenue Mix (FY25)

SegmentRevenue (₹ Cr)% of Total RevKey Drivers & Emoji
Ports & Terminals25,000¹~82 %Container, Coal, Oil, Agri 🚢
Logistics2,4388 %Rail, Road, Warehousing 🚚
SEZ & Port‐Infra1,8296 %Land leases, CFS yards 🏭
Ops & Maintenance1,2084 %Third‐party port services 🔧

¹ Estimated: 82 % × ₹ 30,475 Cr total revenue.

  1. Ports & Terminals (82 %):
    • Mundra led the fleet—80 %+ container throughput; plus Hazira, Dighi, Kattupalli, Krishnapatnam.
    • OPM ~ 60 %—“High‐margin harbor business.”
  2. Logistics (8 %):
    • Rail: Dedicated Freight Corridor advantages → container rail rakes from Mundra → hinterland.
    • Warehousing: Demand from e‐commerce surges.
    • Road: Last‐mile distribution of inbound cargo.
  3. SEZ & Port‐Infra (6 %):
    • SEZ Rentals: Mundra SEZ (multi‐product zone) rents + royalty from developers.
    • CFS (Container Freight Stations): Inland container depots—charging rent & handling fees.
  4. Ops & Maintenance (4 %):
    • Third‐party Port O&M: Operates Kandla Port berths under contract—steady fee‐based revenue.

Takeaway: Ports & Terminals are the “bread & butter,” but Logistics and SEZ add a few crackers on the side.


6) Peer Comparison—Is APSEZ in the Captain’s Seat? ⚓

CompanyCMP (₹)P/EEV/EBITDAROCE (%)OPM (%)Net Debt (₹ Cr)One‐line Quip
Adani Ports & SEZ1,47229.520.514 %60 %30,395“Port kingpin—just try sinking this ship!”
JSW Infrastructure30442.425.014 %59 %13,000“Sibling rivalry on the coast 🚢 vs 🚢”
Gujarat Pipavav Port15719.112.025 %56 %1,500“Casual player—low debt, modest volumes.”
Allcargo Terminals3022.610.212 %11 % – 300 (Cash)“Logistics specialist—feels small next to APSEZ.”
VMS Industries (Rubber)4315.68.527 %20 %100“Rubber belting—random peer, but hey, rubber floats.”

High P/E ≈ 29.5 ×—Investors pay a premium for “port mojo,” but JSW Infra trades at 42 × (higher growth expectation?).

Net Debt: APSEZ’s ₹ 30,395 Cr dwarfs Pipavav’s ₹ 1,500 Cr; but ROCE (14 %) is on par with peers, so they’re not sinking yet.


7) Risk Radar & Upside “Tide” 🚨🌅

RiskWhy It’s a Pothole
High Leverage 🏦Net debt ₹ 30,395 Cr → interest ₹ 2,532 Cr (FY25). Any rate hike or slower cash collections could muscle margins.
Capex Overhang 🔨Multiple greenfield/brownfield projects ongoing (Dighi, Krishnapatnam expansions). Execution delays can bleed cash.
Regulatory Currents 🌊Port tariffs controlled by Tariff Authority (TAMP) sometimes limit hikes; excessive reliance on government nods.
Global Trade Slump 📉Any slowdown in exports/imports (US–China trade wars, global recession) dents volumes swiftly—“Empty berths, empty coffers.”
Competition from PPP 🆚Private ports (JM Baxi, Mundra rivals) & govt ports (JNPT, Kandla) keep bidding for cargo; price wars lurk.
SEZ Slowdown 🔄If SEZ rentals drop (land‐use policy changes, global slowdown), topline from SEZ shrinks.

If global trade drops 10 %, APSEZ’s volumes could shrink ₹ 3,000 Cr revenue → ₹ 600 Cr EBITDA loss. That’s a Titanic‐sized hit. 🛟

But on calmer waters:

  • Renewables Pivot ☀️: Solar panels on port rooftops + green corridors → lower opex + “ESG brownie points.”
  • Rail‐to‐Sea Synergy 🚂 🚢: DFCC launch → cheaper hinterland connectivity.
  • Value‐added Services 📦: Warehousing for e‐commerce, cold‐chain for perishables—non‐cyclical revenue boost.

8) Dividend & Shareholding Snapshot 💸

  • Dividend History (₹/share):
    • FY21: ₹ 3.00 (12 % payout)
    • FY22: ₹ 4.00 (10 %)
    • FY23: ₹ 8.00 (22 %)
    • FY24: ₹ 15.50 (16 %)
    • FY25: ₹ 20.00 (14 %)

Yield ≈ 0.48 %—a drop in the ocean for a high‐growth infra behemoth.

  • Shareholding (Mar 2025):
    • Promoters: 65.89 % (Gautam Adani + family)
    • FIIs: 13.43 % (“Are foreign whales anchoring?”)
    • DIIs: 14.73 % (modest Indian institutional faith)
    • Public: 5.94 % (retail pockets remain small—maybe because ₹ 1 Lakh hardly buys one share?)

Low public float (5.94 %) = high volatility on big block trades.


9) The “Anchor or Churn” Verdict—Hold Your Port or Bail? ⚓🧐

MetricRatingRationale
Revenue Growth★★★★☆+ 36 % → + 28 % → + 14 % (FY21–FY25). Still healthy for infra, even as post‐pandemic normalization hits.
Margin Resilience★★★★★OPM ~ 60 % across cycles—“nobody plays in the mud like a port.”
Balance Sheet Quality★★☆☆☆High net debt (~₹ 30 K Cr); interest ~ ₹ 2,532 Cr; but steady CFO cushions capex.
Valuation Comfort★★☆☆☆P/E ~ 29.5 × and EV/EBITDA ~ 20.5 ×—not exactly cheap, but comparable to JSW Infra (P/E ~ 42 ×).
Dividend Yield★☆☆☆☆0.48 % yield—peanuts for income seekers (you’re here for growth, not dividends).
Risk Profile★★☆☆☆Interest‐rate risk, regulatory headwinds, global trade uncertainty—but well‐diversified ports cushion blow.

Final Take:
Adani Ports is like a “Freight Train on Water”—massive scale, high margins, and strong cargo traction. If you believe Indian trade will keep buzzing, and the Adani Group’s ability to roll out new terminals smoothly, APSEZ is your ocean‐liner. But if you dread rising interest rates, debt overhang, or a global slowdown (hello, trade wars!), you might want to drop anchor temporarily.

🏴‍☠️ Cautionary Tale: When a cyclone hits (trade slump + interest spurt), high leverage can create waves that even a port titan struggles to weather. 🌀

Author: Prashant Marathe
Date: 7 June 2025

Meta Description: Adani Ports & SEZ’s five‐year journey: Revenue ₹ 12,550 Cr → ₹ 30,475 Cr; PAT ₹ 5,049 Cr → ₹ 11,061 Cr. OPM ~ 60 %, but net debt ₹ 30 K Cr. High margins vs. high leverage—growth anchor or deep‐sea risk?

Prashant Marathe

https://eduinvesting.in

Leave a Comment

Popular News

Disclaimer: Eduinvesting articles are for informational and educational purposes only. It is not investment advice, nor a recommendation to buy or sell any securities. Always do your own research or consult a SEBI-registered professional.

© 2025 EduInvesting.in – All rights reserved.
Finance news, market sarcasm, and stock market commentary delivered daily with zero jargon and maximum masala.

Built by humans. Powered by chai. Inspired by FOMO.

Scroll to Top