Meyer Apparel Ltd Q3 FY26 – ₹0.01 Cr Quarterly Sales, -229% OPM & a Balance Sheet That Looks Like It Went on a Crash Diet
1. At a Glance – The ₹2 Shirt with a ₹17.6 Cr Market Cap Attitude
Meyer Apparel Ltd is one of those stocks that makes you stare at the screen, rub your eyes, refresh the page, and still ask yourself: “Bhai, yeh chal kya raha hai?” A company with a market cap of ₹17.6 Cr, trading at ₹2.19, selling just ₹0.01 Cr in the latest quarter, yet confidently sitting on Dalal Street like it belongs to the big boys. The last three months haven’t been kind either, with the stock delivering -11.3% return, while six months show -10.6%, though one-year returns look deceptively positive at 28.8% — because even a dead cat bounce needs legs sometimes.
Operationally, things are… let’s say “minimalist”. Operating Margin at -229%, Price to Sales at 51.8x, Interest Coverage at -24.7, and a Current Ratio of 0.02 — which basically means liquidity is a concept, not a reality. The company has been reporting losses for years, net worth is deeply eroded, and book value stands proudly at ₹ -4.12, which is accounting’s way of crying silently. And yet, promoters hold 74.3%, calm and unbothered, like this is all part of a master plan we peasants just don’t understand.
Curious already? Good. Because it only gets more entertaining from here.
2. Introduction – From Global Suits to Local Survival Mode
Incorporated in 1993, Meyer Apparel Ltd once had global ambitions — exporting men’s suits and trousers to USA, Canada, Europe, and the Middle East. That alone sounds fancy enough to justify a glossy brochure and a well-lit boardroom. Promoted by the KBSH Group, Haryana, along with Singapore-based Thakral Group, the company positioned itself as a wholesaler-retailer hybrid with outsourced manufacturing muscle.
Fast forward three decades, and Meyer Apparel feels less like a global fashion brand and more like that uncle who still talks about his Dubai trip from 2005. The business today is a shadow of its former self, with revenues shrinking year after year and losses becoming a permanent resident on the P&L.
The management says it is “exploring new avenues” and “expanding online”. Investors hear this line so often that it has become corporate background music. Meanwhile, quarterly sales have collapsed 96% YoY, landing at a jaw-dropping ₹0.01 Cr in Q3 FY26. That’s not a typo. That’s literally one lakh rupees.
So the real question is: is this a turnaround story waiting for its montage, or a slow-motion exit wrapped in fabric metaphors? Let’s unzip the numbers.
3. Business Model – WTF Do They Even Do?
Meyer Apparel operates in men’s ready-made garments, primarily suits and trousers, with side hustles in accessories like wallets, watches, ties, eyewear, and some casual wear thrown in — jeans, t-shirts, sweaters, sneakers. Basically, if a man can wear it, Meyer once tried selling it.
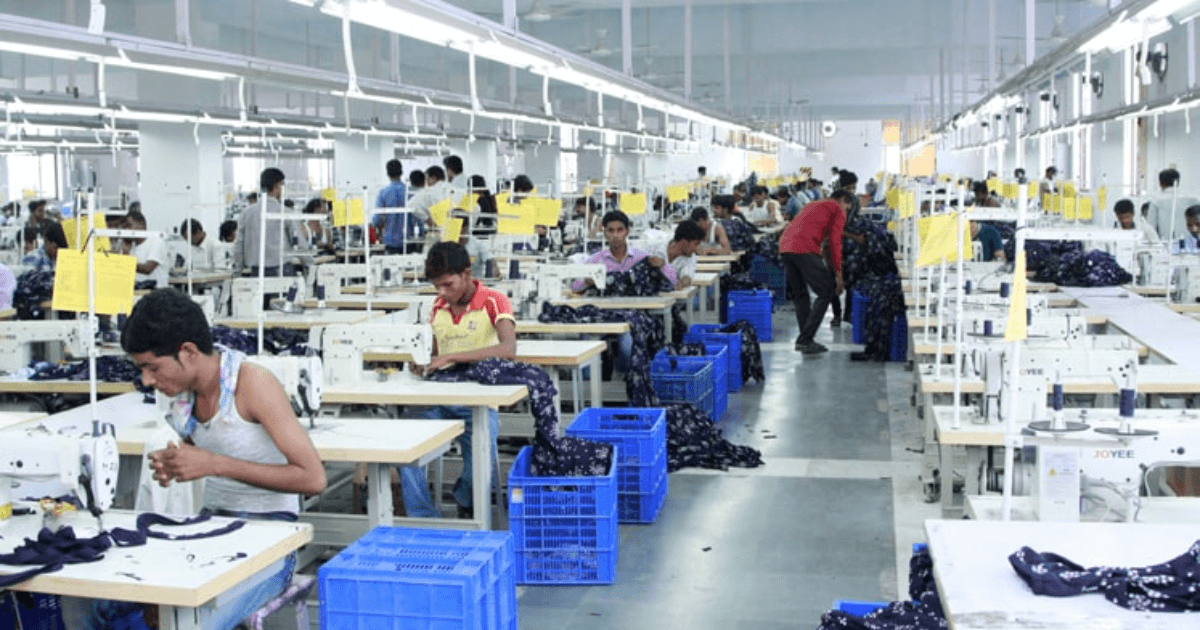
The company doesn’t aggressively manufacture in-house. Instead, it works through contract manufacturing, with a production unit near New Delhi capable of producing 600 jackets and 800 trousers per 8-hour shift. On paper, that’s decent capacity. In reality, when quarterly sales are ₹0.01 Cr, that factory is either extremely relaxed or producing suits for a parallel universe.
Revenue-wise, 94% comes from sale of products, with 6% from other non-operating income. No fancy subscription model, no brand licensing bonanza, no digital-first miracle yet. Just old-school garment selling — except the selling part seems optional these days.
They are “expanding online”, but the numbers suggest the internet hasn’t noticed yet. Question for you: if capacity exists but demand doesn’t, is it a business problem or a relevance problem?
4. Financials Overview – The Quarterly Numbers Nobody Wants to Look At
Result Type Detected: Quarterly Results (Q3 FY26) Annualised EPS = Latest EPS × 4
Yes, PAT “improved” because losing ₹0.17 Cr is apparently better than losing ₹0.27 Cr. This is what accountants call progress and investors call coping.
Operating margins are still catastrophic, but the rate of bleeding has slowed. Is that a sign of stabilization or just the business running out of blood? You decide.
5. Valuation Discussion – When Valuation Models Start Laughing
Let’s do this carefully, because valuing loss-making microcaps is like using a thermometer to measure sarcasm.