If balance sheets could talk, Quality Foils (India) Ltd would say: “Boss, kaam chal raha hai… bas thoda sa oxygen chahiye.” This is a ₹17.6 Cr market cap stainless-steel microcap selling CR strips, coils, and flexible hose pipes to industries that don’t care about glamour — only whether the steel bends when it should and doesn’t when it shouldn’t.
The stock is currently lounging at around ₹61.7, down sharply over the past year, with a Price-to-Book of 0.57 — yes, cheaper than its own accounting dignity. Half-year sales clocked ₹94 Cr, PAT came in at ₹0.83 Cr, and EPS for the latest half year stands at ₹2.91. Annualised? Hold your horses — we’ll lock that later as per rules.
Returns haven’t exactly been a firecracker show: –11.9% over 3 months, –37.7% over 1 year. Promoters, however, seem to be in a “mera hi bachcha hai” mood, raising their holding steadily to 59.6%, with zero pledge. Debt is chunky at ₹68 Cr, ROCE is a sleepy 4.19%, and interest coverage barely clears the “don’t default” bar at 1.78.
So the big question: Is this a battered steel utensil that still works… or scrap waiting for the melting furnace? Let’s investigate.
2. Introduction – Enter the Stainless Steel Detective
Founded in 1990, Quality Foils has survived three decades of commodity cycles, steel crashes, steel booms, Chinese dumping fears, Indian infra dreams, and the occasional banker’s raised eyebrow. That alone tells you this is not a fly-by-night jugaad.
But survival is not the same as thriving.
The company operates in a brutally competitive segment where margins are thinner than stainless foil itself. Customers negotiate like it’s a vegetable mandi, raw material prices swing daily, and one bad capex cycle can turn profits into poetry — tragic poetry.
What makes Quality Foils interesting is not explosive growth, but stubborn continuity. Sales hover around ₹150–180 Cr annually, profits exist (barely), and the company keeps reinvesting to stay relevant. FY24 and FY25 saw machinery capex of ₹20 Cr, funded by internal accruals and loans, because nothing says optimism like borrowing more when ROCE is under 5%.
But before dismissing it as another steel dud, remember: this company sits 5 km from Jindal Stainless, its key raw material supplier. In steel logistics, distance matters more than motivation speeches.
Is this a turnaround waiting patiently? Or just a stainless steel treadmill? Let’s break it down.
3. Business Model – WTF Do They Even Do?
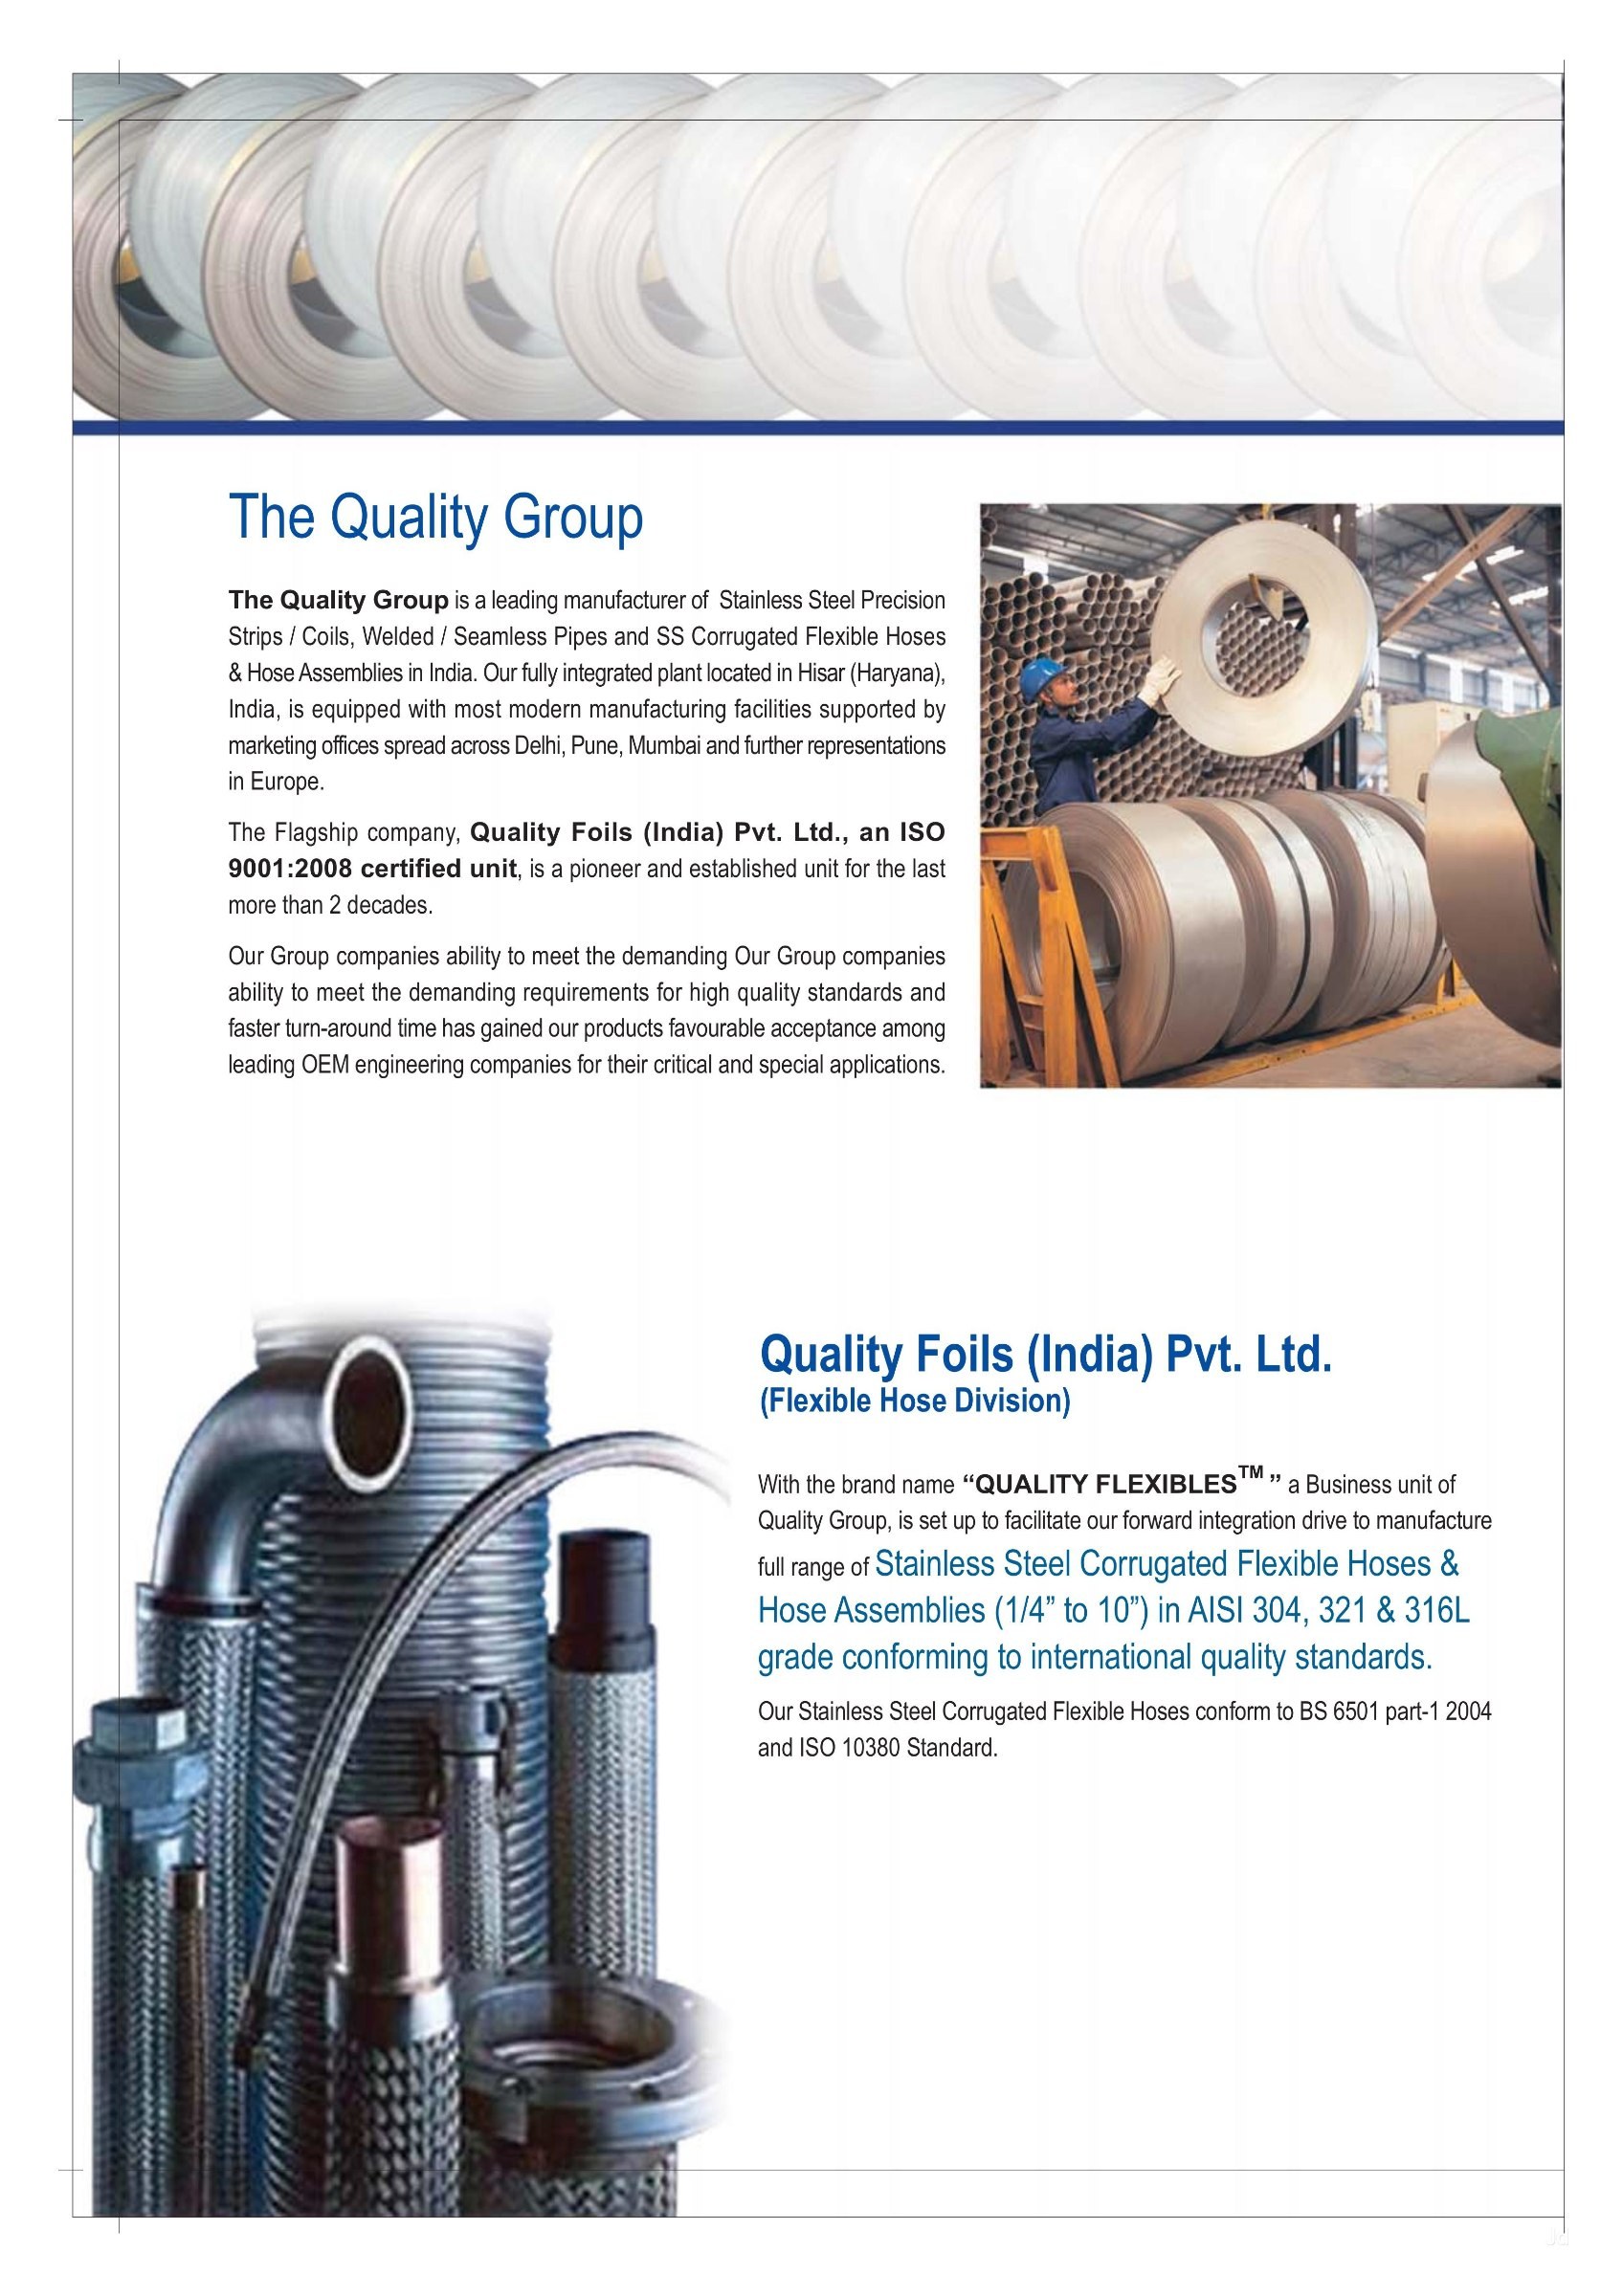
Imagine buying giant stainless steel sheets, rolling them thinner, cutting them into precise shapes, and selling them to hundreds of boring but essential industries. Congratulations — you now understand Quality Foils.
The company manufactures:
Cold Rolled (CR) Stainless Steel Strips & Coils
Stainless Steel Flexible Hose Pipes
These are used everywhere — utensils, LPG stoves, automobiles, furniture, kitchen sinks, electronics, and industrial fabrication. No one brags about them at parties, but without them, half the country’s kitchens and factories would throw a tantrum.
In FY24, the company produced ~6,783 MT and sold ~6,787 MT, which basically means inventory doesn’t get to rest. Installed capacity stands at:
12,000 MT per annum for CR strips/coils
2 lakh meters per annum for SS hose pipes
Exports form a tiny 2%, with the rest sold domestically. Countries include the USA, Germany, Turkey, China, and others — meaning Quality Foils has at least cleared some international quality checklists.
This is a volume-driven, low-margin, high-working-capital business. If steel prices sneeze, margins catch cold. If customers delay payments, the cash flow gets asthma.