Mercury Laboratories Ltd Q2 FY26 (Sep 2025) – ₹19 Cr Quarterly Revenue, 228% Profit Jump, Yet ROE Still Stuck in Single Digits
1. At a Glance – The Old Pharma Uncle Who Still Shows Up to Work
Mercury Laboratories Ltd is that 62-year-old pharma uncle who wakes up every morning, irons his shirt perfectly, reaches office on time, exports medicines to 25+ countries, and still refuses to upgrade his ROE beyond single digits. As of the latest quarter, the company sits at a market cap of roughly ₹100 crore, trading around ₹837 per share, down about 2.7% over the last three months and roughly 13% over the past year. Sales for the latest quarter came in at ₹19.01 crore, with PAT of ₹1.64 crore, translating into a headline-grabbing 228% YoY quarterly profit growth. Sounds sexy, right? But wait. ROE is still around 5.9%, ROCE is under 9%, and five-year profit growth is… negative. Yes, negative. Mercury Labs is profitable, debt-light, promoter-heavy (73.7%), dividend-paying, and boringly consistent. It’s the kind of company that doesn’t blow up your portfolio but also doesn’t make your relatives jealous at weddings. The latest results show improvement, but the stock market seems to be asking: “Boss, thoda aur dum hai ya bas itna hi?”
2. Introduction – Welcome to a Pharma Company Older Than Your CA
Incorporated in 1962, Mercury Laboratories has survived wars, pandemics, price controls, DPCO nightmares, and more pharma cycles than most startup founders have seen birthdays. The company manufactures and exports pharmaceutical formulations primarily focused on gynaecology and paediatrics. This is not a flashy biotech innovator chasing GLP-1 molecules. This is a bread-and-butter formulations player selling tablets, liquids, injectables, and drops that doctors have been prescribing since Doordarshan was cool.
What makes Mercury interesting is not hypergrowth but survival. It operates in a brutally competitive industry where margins are squeezed, compliance costs rise every year, and regulators wake up daily with new checklists. Despite this, Mercury continues to post profits, maintain exports, pay dividends, and avoid promoter drama. No pledging, no dilution, no sudden “strategic transformation” PowerPoint decks.
However, consistency has come at a cost: growth. Over the last five years, sales have grown at barely mid-single digits, while profits have actually declined on a compounded basis. The recent quarterly spike in profits looks impressive on paper, but the longer-term trend remains lukewarm. So the real question is: is Mercury Labs finally waking up… or is this just another quarterly sugar rush?
3. Business Model – WTF Do They Even Do?
Mercury Laboratories is a formulations-focused pharma company manufacturing a wide range of therapeutic products. Its portfolio reads like a medical dictionary: analgesics, antibiotics, antifungals, antimalarials, cardiovascular drugs, CNS drugs, anti-diabetics, steroids, uterine stimulants, multivitamins, protein supplements, and even small volume parenterals and eye/ear drops.
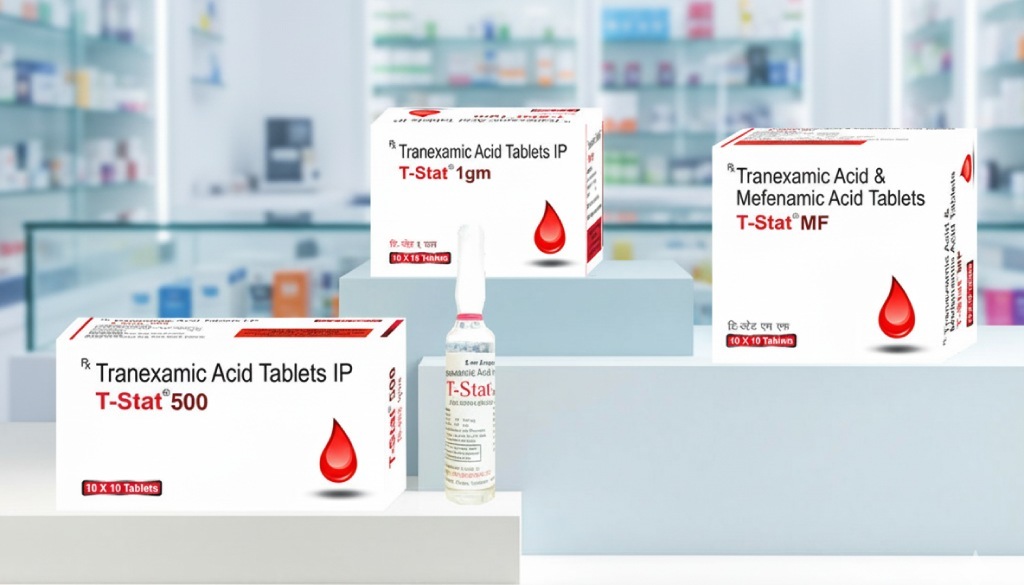
In simple words, Mercury doesn’t bet on one molecule or one therapy. It plays volume, diversification, and longevity. Major brands like K-Win, Gravidol, T-Stat, Merizyme, Promolact, Ovaryl, and K-Stat cater mainly to gynaec and paediatric segments. These are not blockbuster brands advertised on IPL jerseys, but steady prescription names in clinics.
Revenue-wise, about 84% comes from the domestic market and around 16% from exports. Export presence spans over 25 countries directly and another 15 indirectly across Southeast Asia, Africa, and Latin America. This diversification provides some currency hedge and geographic risk balance, though exports are not yet large enough to dramatically lift margins.
Manufacturing is the core competency. The company is also investing in a new Small Volume Parenteral (SVP) plant with a planned capacity of 75 million units and an estimated investment of ₹30 crore. However, commissioning has been deferred to December 2026 due to Schedule M revisions. Translation: more capex, more compliance, more waiting.
4. Financials Overview – Numbers Don’t Lie, But They Do Yawn Sometimes
Result Type Locked: Quarterly Results Annualised EPS Method: Latest quarterly EPS × 4
Quarterly Comparison Table (Figures in ₹ Crores)
Source table
Metric
Latest Qtr (Sep 2025)
Same Qtr LY (Sep 2024)
Prev Qtr (Jun 2025)
YoY %
QoQ %
Revenue
19.01
18.19
18.14
4.51%
4.79%
EBITDA
2.13
1.31
2.36
62.6%
-9.7%
PAT
1.64
0.50
0.97
228%
69.1%
EPS (₹)
13.67
4.17
8.08
228%
69.2%
Annualised EPS based on latest quarter comes to roughly ₹54.7. At a current price of ₹837, this implies an annualised P/E of around 15.3x, lower than the reported trailing P/E due to recent profit improvement.
Commentary: Revenue growth is steady but unexciting. Profit growth, however, has exploded mainly due to operating leverage and lower comparative base. EBITDA margins improved to around 11.2%. The key question: is this sustainable or just a good quarter?
5. Valuation Discussion – Fair Value Range, Not Fantasy
Method 1: P/E Based
Annualised EPS: ~₹54.7
Conservative P/E range for smallcap pharma: 14x – 18x