Because even 100-year-old brands sometimes forget to add primer before painting their margins.)
1. At a Glance
If there’s one thing Kansai Nerolac Paints Ltd (KNPL) has mastered over its century-long existence, it’s surviving competition with a glossy smile. Born in 1920 as Gahagan Paints & Varnish, and now the Indian arm of Kansai Paint Co., Japan, this company has been painting everything from Maruti’s bumpers to your living room’s “off-white eggshell” walls.
As of November 2025, KNPL trades at ₹246 with a market cap of ₹19,915 crore — a far cry from Asian Paints’ ₹2.5 lakh crore kingdom but still respectable for India’s third-largest paint player. The stock’s 3-month return of +5.8% suggests the market believes this paint isn’t peeling off yet.
In Q2 FY26, revenue came in at ₹1,954 crore with a net profit of ₹135 crore. The quarterly OPM of 11% looked thinner than a single coat of primer, and EPS stood at ₹1.67. With ROCE at 13% and ROE at 10.4%, Nerolac’s colours are more pastel than vibrant. But hey — almost debt-free (Debt/Equity 0.04) and a 1.01% dividend yield? Not bad for a company that literally sells gloss.
Now, let’s roll up our sleeves and see what’s under that shiny coat.
2. Introduction
If Asian Paints is the Shah Rukh Khan of Indian paints, Kansai Nerolac is that underrated character actor — reliable, present in every movie, but rarely gets top billing. From Maruti Suzuki’s glossy red hatchbacks to your neighbourhood housing society’s fresh coat of Suraksha Plus, Nerolac has quietly coloured India’s growth story.
The company’s Japanese parent, Kansai Paint Co., owns 75% and sends over a steady supply of kaizen, technology, and perhaps a little existential calm. But while Japanese efficiency has its charm, the Indian paint market is no zen garden — it’s a messy Holi festival where giants like Asian Paints and Berger splash margins and volumes in every direction.
Nerolac’s recent results show a cautious approach: Q2 FY26 revenue of ₹1,954 crore, barely 0.14% up YoY, while PAT grew ~10%. Growth is slow, but profit discipline remains. You could call it the “no-drip” strategy — not flashy, not messy, just consistent.
So what’s the problem? The problem is that paint, like politics, is all about perception. The market doesn’t reward being merely competent; it wants “vibrant expansion.” And KNPL has spent the last few years caught between raw material volatility, muted housing growth, and rising competition from upstarts like Indigo Paints.
Still, the company’s playbook for FY26 — premiumisation, capacity expansion, influencer outreach, and IOT-led digital factories — shows that even the old brush wants to learn new strokes.
3. Business Model – WTF Do They Even Do?
Kansai Nerolac’s business can be divided neatly like paint swatches on a wall:
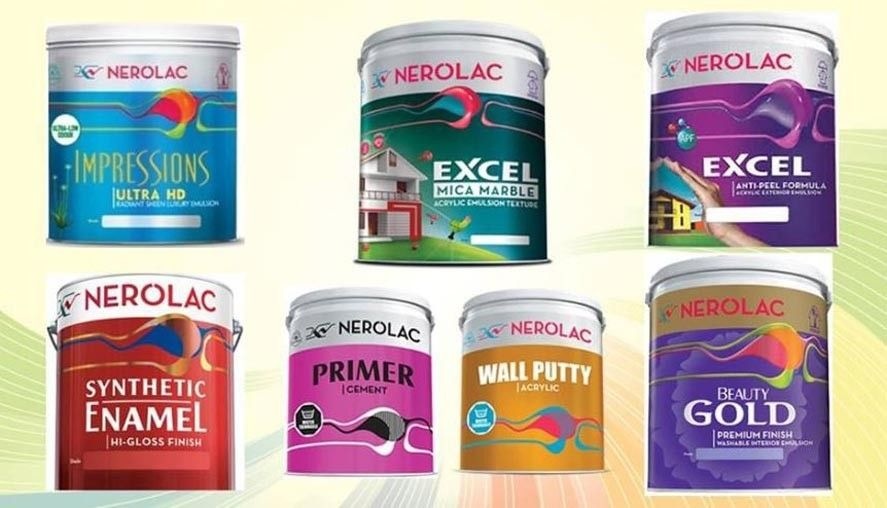
- Decorative Paints (Interiors & Exteriors): The glossy stuff you and I buy — Impressions, Beauty Gold, Excel Top Guard. This is the volume driver, contributing 70–75% of India’s paint demand. KNPL’s strategy here: push Paint+, a premium sub-brand that screams “I’m not Berger.”
- Industrial Coatings: The real moneymaker. Think automotive paints for Maruti, Honda, and Tata. KNPL leads this segment with OEM relationships dating back decades.
- Performance & Powder Coatings: Used in electricals, furniture, and metal goods. Also includes auto refinish and wood finishes.
- Others: Adhesives and waterproofing — because every Indian house eventually leaks like an old Bollywood script.
The distribution muscle is impressive: 29,500 dealers, 20,000 tinting machines, and 112 depots. Add 80+ NxtGen Shoppes and 250+ city-level influencer programs connecting 5,000+ architects — Nerolac isn’t just selling paint anymore; it’s selling lifestyle walls.
Online meets Offline: The NxtGen Paint Service and Paint+ offerings combine e-commerce convenience with physical dealer support — a hybrid model that’s basically “Swiggy for paint.”
Industrial Backbone: With 8 manufacturing units across India and a total capacity of 611 million litres/year, KNPL has operational