1. At a Glance
The 96-year-old South Indian Bank (SIB) — the grandpa of Kerala banking — has suddenly become the cool uncle of the small-cap banking party.
Once mocked as “the last surviving dinosaur of Thrissur”, it’s now trading near ₹38.8, up 31.7% in 3 months and 55.9% in a year, while some new-age fintech bros are still trying to figure out how interest rates work.
Market Cap? ₹10,145 crore.
Book Value? ₹40.6 — meaning the stock is trading at just 0.96x book, cheaper than a second-hand dosa tawa.
PAT for Q2FY26: ₹351 crore (8% QoQ, 8.2% YoY).
NIM: 3.3%.
ROE: 13.8%.
Gross NPA: 2.93%.
Net NPA: 0.56%.
CASA: 31.9%.
The balance sheet now has ₹1.36 lakh crore in assets, ₹1.15 lakh crore in deposits, and more digital activity than a teenage gamer — 97.5% transactions online.
Once considered a South-only lender, SIB’s turnaround has been nothing short of cinematic — the “Lucifer” of Indian banking, with a new director, fewer scams, and a surprisingly fit NPA figure.
2. Introduction
There was a time when saying you held South Indian Bank shares was like confessing to still using a Nokia 1100.
Now, suddenly, everyone wants to “revisit” their valuation model — which is code for “we laughed too early”.
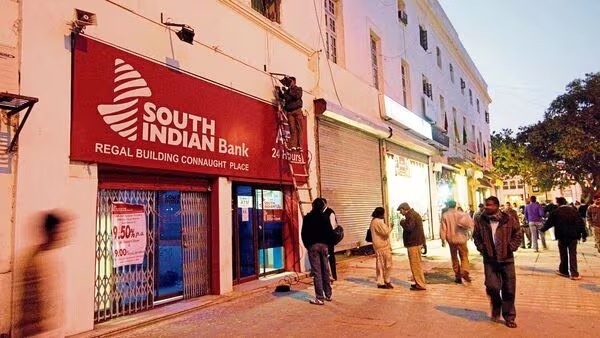
Founded in 1929, when RBI itself was in beta testing, SIB is Kerala’s oldest private sector bank. It has 948 branches, 1,315 ATMs, and a loyal fan base that still thinks cheque leaves are magical documents.
The last decade was brutal — slow loan growth, high NPAs, zero brand recall outside Kochi weddings, and constant regulatory drama.
But somewhere between FY22 and FY25, the management finally started behaving like they attended a risk-management workshop.
NIMs stabilized around 3.2–3.3%, asset quality improved, and the bank cleaned up its loan book.
It even dared to raise ₹1,150 crore through a rights issue at ₹22/share in FY24 — the corporate equivalent of saying, “We’re done begging RBI for oxygen.”
And now, after decades of “almost-turnaround” stories, SIB’s numbers finally match its hype.
So… is this the Malayalam banking comeback story of the decade? Or just another pre-interval twist?
3. Business Model – WTF Do They Even Do?
Think of SIB as a mini HDFC Bank clone, but with a strong South Indian accent and a limited budget for advertising.
The business model is your standard retail + corporate + treasury cocktail:
- Retail & Personal Loans (23%) – Housing, Gold, Vehicle, Mortgage, Credit Cards.
- Business Loans (20%) – For traders who think balance sheets are optional.
- Corporate Loans (38%) – Mostly A & above rated, because SIB finally learned the “no more random builder funding” lesson.
- Agriculture (19%) – Because every Kerala bank needs one coconut tree in its portfolio.
The bank earns from:
- Interest income on loans (yield on advances: 9.28%).
- Treasury operations, playing bond markets like a cautious mutual fund uncle.
- Fee income, selling insurance, mutual funds, and remittances.
And yes, it