1. At a Glance
Imagine a company that converts dusty rock into shiny profits and government subsidies into solid EPS. That’s Krishana Phoschem Ltd (KPL) — the Ostwal Group’s golden goose fertilizing India’s farmlands and investors’ portfolios alike.
At ₹584 a share (as of 20 Oct 2025), this ₹3,538 crore market-cap fertilizer magician has pulled off a 171% 1-year return, 111% in 6 months, and a profit growth of 176% — the kind of numbers that make DAP (Di-Ammonium Phosphate) look like Dope And Profit.
Q2 FY26 numbers smell like freshly spread manure — Revenue ₹608 Cr (+102% YoY), PAT ₹33 Cr (+98% YoY), EPS ₹5.48. OPM? A humble 12%, because fertilizer margins are like farmers’ smiles — never consistent.
ROE is 25%, ROCE 21.7%, and the company is leveraged just enough (Debt ₹413 Cr; D/E 0.93) to keep CRISIL analysts awake at night.
Now let’s audit this fertilizing phoenix that grew from SSP dust to DAP glory.
2. Introduction – When Subsidy Meets Strategy
Krishana Phoschem isn’t your average fertilizer maker. It’s the lovechild of Indian agriculture and bureaucratic subsidy letters — and it has learned to dance between urea politics and phosphate economics better than a Delhi babu in budget season.
Incorporated in 2004 under the Ostwal Group umbrella, this company quietly turned low-grade rock phosphate into high-margin fertilizer. Today, it’s India’s second-largest Single Super Phosphate (SSP) manufacturer and a rising star in the DAP/NPK complex fertilizer game.
The Meghnagar plant in Madhya Pradesh, once home to a defunct Spanish facility, now hums with sulphuric and phosphoric acid fumes — and cash flow. The company proudly claims full backward integration — basically, it makes everything from raw acid to final fertilizer under one roof. Think of it as the “Thali” version of chemical manufacturing: one plate, many spicy components.
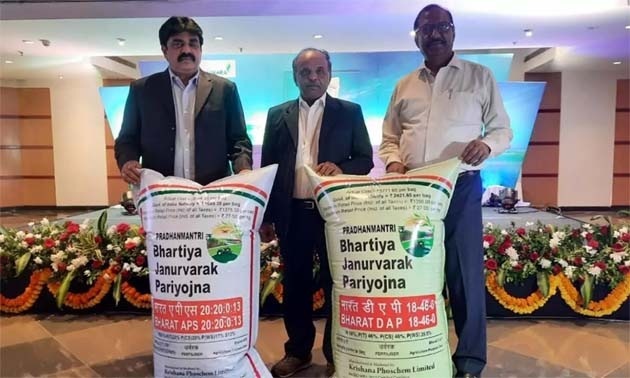
Its brands Annadata (SSP) and Bharat (NPK/DAP) are sold through a 2,500-strong dealer network and 30,000 retailers — meaning your local farmer’s field is probably blessed by Krishana’s chemistry.
But here’s the twist — nearly 37% of revenue comes from government subsidies, proving that even in capitalism, socialism still foots the bill.
3. Business Model – WTF Do They Even Do?
Let’s break it down. Krishana Phoschem’s business model is part science, part subsidy, and part jugaad.
The company mines or imports rock phosphate, converts it into phosphoric acid using sulphuric acid (which it also manufactures), and then processes that into DAP and NPK fertilizers — the nutritious food Indian soil needs to stay alive.
It’s like a chef who grows his own vegetables, makes his own spices, cooks the food, and then gets paid half the bill by the government. Genius.
FY24 revenue mix shows how focused they’ve become:
- Fertilizers: 93%
- Chemicals: 7%
Product-wise sales: