Lyka Labs Ltd – 681% Profit Growth, 35-Year Debt Hangover, and an Ipca Parent Trap
1. At a Glance
Lyka Labs is the pharmaceutical version of that cousin who suddenly becomes serious about gym after 20 years of laziness. Once a struggler with patchy profits, it pulled a 681% profit growth (TTM) stunt, only to remind everyone in the latest quarter that the treadmill is still shaky (PAT down 35% YoY). At ₹99/share, the stock looks like a penny pharma trying to cosplay as a mid-cap.
2. Introduction
Born in 1976, Lyka Labs has seen everything – from boom to bust to bailouts. The company makes lyophilized injections, creams, gels, ointments, foams, and APIs, but the bigger story isn’t what it sells; it’s who controls it. Enter Ipca Labs, which now owns ~31.4% (moving to 40.9% by FY25). Translation: Ipca is the strict parent making sure the teenager doesn’t overspend pocket money on motorcycles.
Over the years, Lyka has:
Wandered across APIs, formulations, and outsourcing deals.
Been a contract manufacturer for bigger names (basically, pharma’s “ghostwriter”).
Expanded exports to Southeast Asia, Africa, and Latin America.
Dabbled in critical care and even animal health (because why only humans?).
Yet, despite the shiny WHO-GMP badges, the financial history is a rollercoaster. Investors keep asking: is Lyka finally stable under Ipca’s control, or will it go back to being the pharmaceutical soap opera it was?
3. Business Model – WTF Do They Even Do?
Lyka’s business model is simple: make stuff for others, sell some under your own brand, and hope Ipca keeps paying the bills.
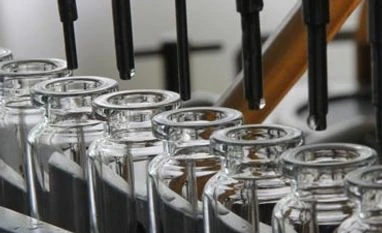
Formulations (92% of revenue): The bread and butter. Dermatology, cosmeceuticals, injectables, nutraceuticals.
APIs (3%): Too tiny to matter.
Other Operating Revenue (5%): Licensing, services, and pharma side hustles.
Services:
Contract Manufacturing – Clients give raw material, Lyka makes the medicine, takes a fee. Basically, “tu maal laa, main banaata hoon.”
In-Licensing – Gets products from global players to sell in India.
Out-Licensing / Loan Licensing – Lets others use its facilities.
Export split: 53% exports vs 47% domestic.
4. Financials Overview
Metric
Latest Qtr (Jun’25)
YoY Qtr (Jun’24)
Prev Qtr (Mar’25)
YoY %
QoQ %
Revenue
₹33.0 Cr
₹30.1 Cr
₹33.4 Cr
9.7%
-1.2%
EBITDA
₹3.7 Cr
₹3.7 Cr
₹4.1 Cr
-0.8%
-10.0%
PAT
₹0.99 Cr
₹1.29 Cr
₹2.03 Cr
-23.2%
-51.3%
EPS (₹)
0.26
0.40
0.50
-35.0%
-48.0%
Commentary: Sales inching up, but profits melting like cheap lipstick. EPS = ₹2.1 (FY25), but stock at 47.7x P/E. Investors clearly betting more on Ipca’s babysitting than Lyka’s performance.
5. Valuation – Fair Value Range
Method 1: P/E
EPS = ₹2.1
Fair P/E for a small-cap pharma = 15–20
Range = ₹31 – ₹42
Method 2: EV/EBITDA
EV = ₹395 Cr, EBITDA = ₹20 Cr
EV/EBITDA = 19.6x. Fair multiple = 10–12x
Value = ₹200–₹240 Cr → ₹56 – ₹68/share
Method 3: DCF
Assume 10% growth, 10% WACC.
Value ~ ₹60/share.
Consolidated Range: ₹31 – ₹68. CMP = ₹99 → Stock trading as if it already became Sun Pharma Lite.
Disclaimer: Educational only.
6. What’s Cooking – News, Triggers, Drama
Amalgamation Scheme – Lyka Exports merging into Lyka