A 1960-born Taparia Group company that makes magnetic assemblies, shunts, cores, and current-sensing products for industries from EVs to defense. Market cap ₹944 Cr, sales ₹198 Cr, PAT ₹17 Cr, margins decent at 15%. But stock trades at 56x earnings — clearly, markets think these magnets have supernatural powers.
2. Introduction
Permanent Magnets Ltd (PML) isn’t your neighbourhood “magnet-on-the-fridge” story. It’s a serious niche engineering company — making custom electrical/magnetic components for industries like power meters, EVs, telecom, defense, even ISRO-level space research. If a current needs to be sensed, a field needs to be shielded, or iron filings need to be pulled out — PML is somewhere in the supply chain.
But here’s the twist: despite the fancy end-user industries (EVs, space, defense), the company is still tiny — ₹200 Cr sales. That’s like claiming to be the backbone of India’s EV revolution while having the turnover of a mid-sized steel re-roller. Investors, though, are treating it like Tesla’s cousin — stock is up 45% in 6 months.
3. Business Model (WTF Do They Even Do?)
PML runs 3 factories in Mira Road, Mumbai, producing 350+ SKUs. Their business divisions:
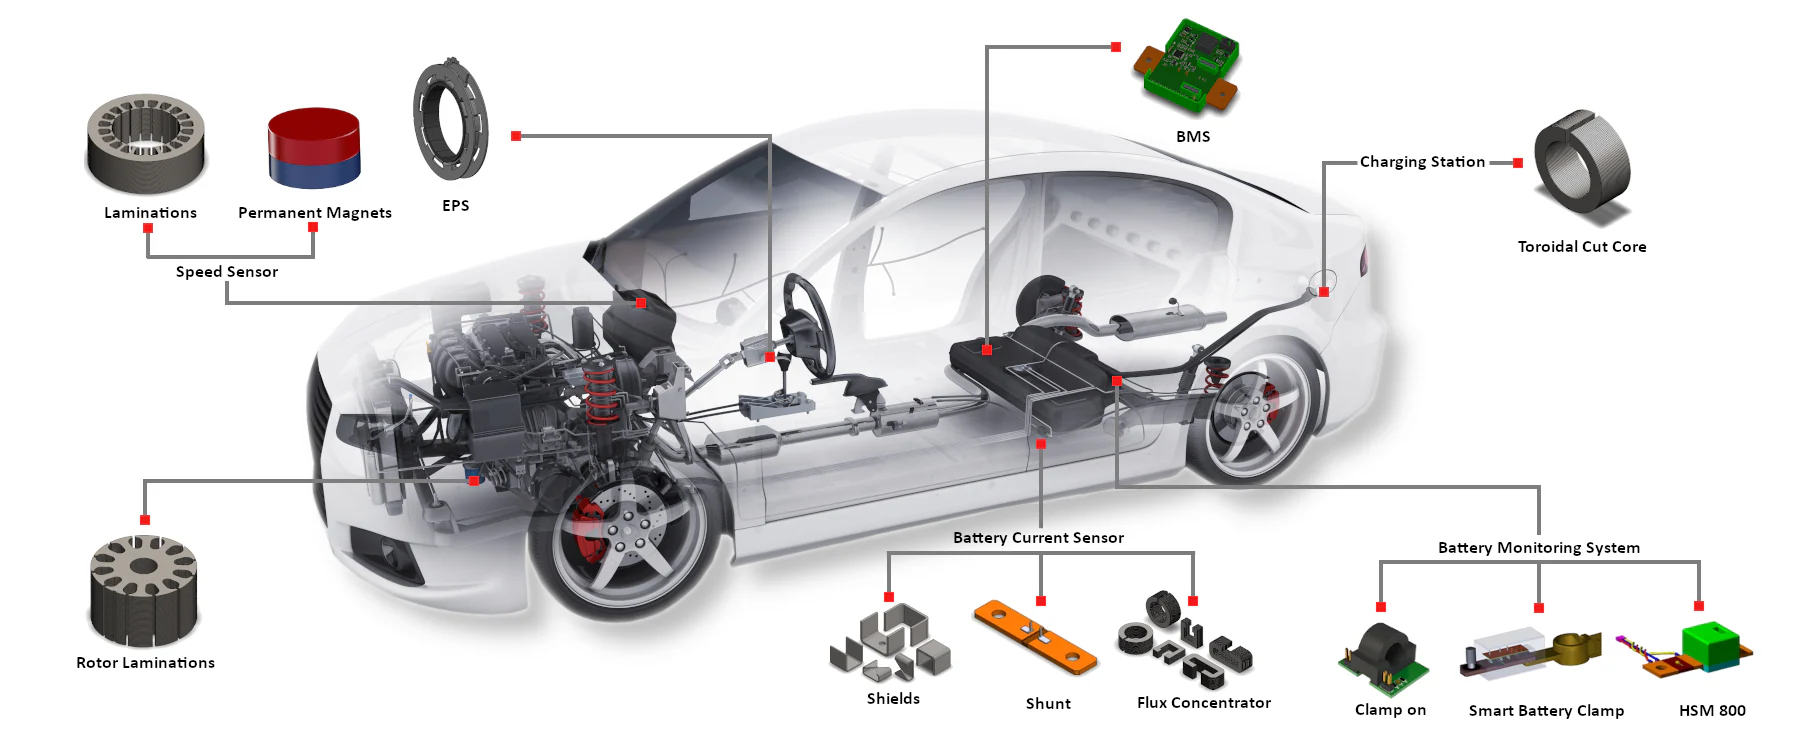
Magnetic Assemblies: Separators, filters, lifters — pulling iron out of places where it shouldn’t be.
Shunts & Brass Terminals: Core product — precision parts for current measurement in meters, inverters, and EV batteries. Basically, every “smart” device needs a dumb but precise shunt.
Magnetic Cores & Shields: Using exotic metals like Mu-Metal to block magnetic interference — used in defense/aerospace.
Magnets for Meters: Old-school but still relevant — Alnico cast magnets, assemblies.
Revenue mix (FY23): 77% Engineering & Current Sensing, 13% Cast Magnets, rest from sundry ops/other income. Geography: Asia 60%, Europe 24%, Americas 15%.
So, business is diversified but still highly concentrated: top 5 clients = 44% sales. If one customer sneezes, PML catches pneumonia.
4. Financials Overview
Q1 FY26 (₹ Cr)
Metric
Jun’25
YoY (Jun’24)
QoQ (Mar’25)
YoY %
QoQ %
Revenue
53.2
54.3
45.3
-2.1%
+17%
EBITDA
11.1
8.7
5.3
+28%
+110%
PAT
7.3
5.8
2.6
+26%
+177%
EPS (₹)
8.5
6.7
3.1
+27%
+174%
Commentary: Strong recovery QoQ, margins back to 20%. But growth YoY is flat — meaning it’s a cyclical/order-driven business, not a smooth FMCG-like compounding machine.
5. Valuation (Fair Value RANGE only)
P/E Method: EPS FY25 = ₹19.4. CMP ₹1,098 → P/E = 56.5x. Industry ~40x. FV at 30–40x