Yuvraaj Hygiene: 854% Return in 1 Year & Scrub Pads That Scrubbed Their Balance Sheet
1. At a Glance
Yuvraaj Hygiene is the kind of stock your broker would laugh at in 2022 (“₹2 penny share, sir, better buy lottery”). Fast-forward to 2025: price hits ₹20, market cap touches ₹169 Cr, and ROCE screams 103%. They sell mops, scrub pads, brooms, wipers — basically everything your maid uses, except this time shareholders are cleaning up.
2. Introduction
Born in 2000, Yuvraaj Hygiene quietly stuck to manufacturing and selling cleaning products. Not sexy, not glamorous, but hey — everyone needs a mop. For two decades, the company stayed tiny, trading below ₹5.
The big turnaround? Between 2021–23, management cleaned up debt, shifted unsecured loans into equity (yes, promoters literally mopped their own debt), and focused on scaling up distribution. Suddenly, revenues doubled, margins flipped positive, and PAT shot up ~6 Cr in FY25.
Stock went from “dustbin” to “Darling.” In one year, it delivered 854% return. Imagine explaining to your CA: “Yes, uncle, my scrub pad company outperformed HDFC Bank.”
3. Business Model (WTF Do They Even Do?)
It’s simple: they sell things that clean your house.
Products
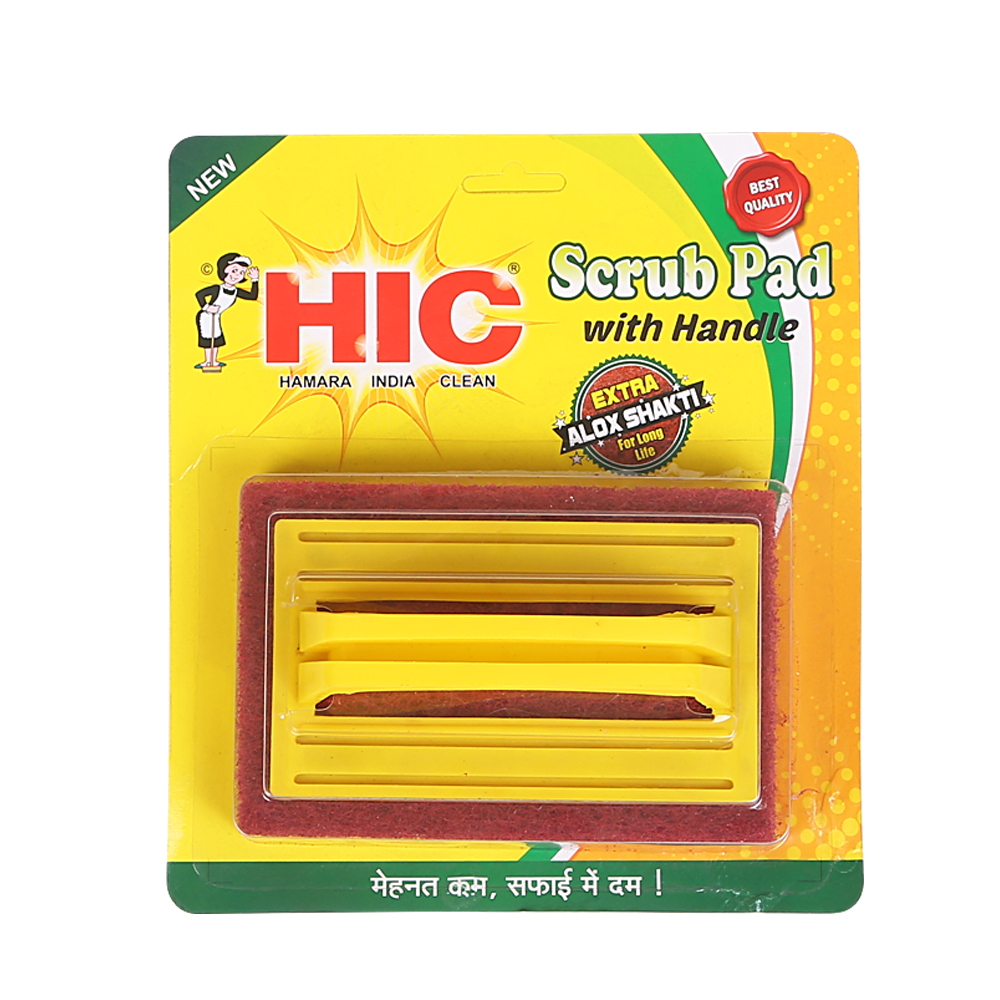
Scrub pads (HIC Scrub, Scrub Super, Scrub with Handle).
Steel scrubbers.
Mops (cotton, PVA, twist, clean-all).
Wipers & brushes.
Toiletry cleaning (toilet brushes, plungers).
Body scrubbers, sponge wipes, brooms.
Revenue is 100% sale of products. No fancy digital infra, no “hygiene tech platform.” Just direct FMCG sales through dealers and distributors.
Question: Isn’t this basically the “Chetak of cleaning products” — cheap, reliable, everywhere?