Morganite Crucible India Ltd: 30% ROCE, 75% Stake Sold & An Open Offer Masala
Date of Publishing -
Spotted a factual error — a wrong number, date, or fact? Tell us and we will check the source.
1. At a Glance
Morganite Crucible is not your average “tile trader” smallcap circus. This is a serious industrial player making crucibles (yes, those pots that melt your non-ferrous dreams into liquid metal). With ₹174 Cr sales, ₹25 Cr PAT, ROCE ~30% and a debt-free balance sheet, it’s the gold standard of boring-but-profitable manufacturing. But the real spice came on 22 Aug 2025, when promoters sold 75% stake to Foseco India at ₹1,557/share (₹654 Cr deal) — triggering an open offer. Shareholders suddenly have more drama than a daily soap.
2. Introduction
Imagine being the unnoticed cousin at a shaadi, serving behind the buffet counter for years. That’s Morganite Crucible — quietly selling high-performance crucibles to foundries, die-casters, and aerospace players.
For decades, it’s been:
Slow sales growth (5–6% CAGR).
Consistent dividends (88% payout).
Rock-solid margins (22% OPM).
Export mix 48% — proper MNC discipline.
And then suddenly, BOOM: Promoters cashed out to Foseco India, a global giant in metallurgical solutions. The deal price? ₹1,557/share — lower than CMP ₹1,714. Irony? Shareholders got the thrill of a takeover but the pain of a discount.
So, is this the “end of an era” or “new furnace of growth”?
3. Business Model (WTF Do They Even Do?)
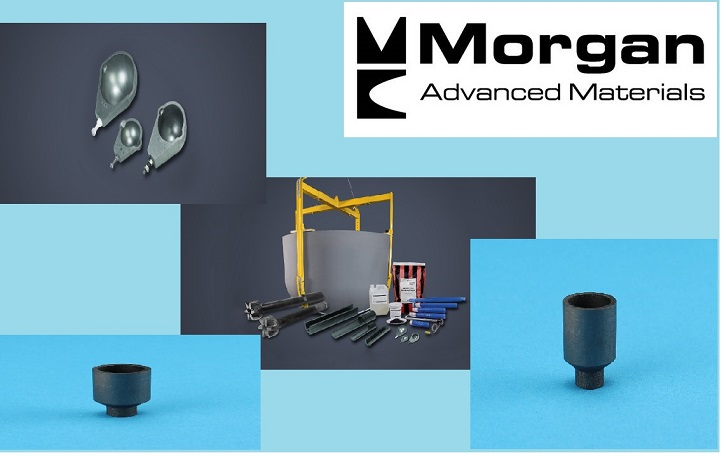
Morganite makes and sells silicon carbide and clay graphite crucibles and allied foundry products. In human language:
Crucibles = Super-heat-resistant containers used to melt metals.
Clients = Tata, Mahindra, Bajaj Auto, Indian Railways, Titan.
User industries = Aerospace, defence, auto, power, petrochemicals.
This is not a “mass retail” game. It’s B2B, sticky customers, high switching costs. If a foundry trusts your crucible to melt aluminium, they’re not changing to a cheaper supplier casually.