1. At a Glance
Magson Retail runs 41 frozen food and gourmet stores but its bottom line is colder than its ice creams. With ₹67 Cr sales and just ₹0.44 Cr profit, the company’s margins are thinner than wafer biscuits. Yet, the stock trades at a P/E of 262 – basically, you’re paying Swiss chocolate price for a local mithai shop.
2. Introduction
Magson started in 2018 with the idea of bringing imported frozen foods and gourmet items to Indian households. Basically, they wanted to be the “Nature’s Basket for the middle class” – except without the basket, and without the margins.
IPO came in July 2023 on NSE SME. Raised ₹13.74 Cr. Listed at ₹118. Today still ₹118. Investors basically paid entry fees and got a free pass to boredom.
On the surface, the story looks tasty: direct procurement (75% sourced straight from manufacturers), expanding store count (from 32 to 41 stores after Goa acquisition), and new brand experiments (Nasta Bazar, Goan Bakery, My Chocolate World). But the financials? They look like diet khichdi. Sales flat, profits collapsing 84% YoY, and promoters reducing stake from 70% → 55.8% in July 2025. When promoters themselves are dumping, public investors are left holding frozen peas.
3. Business Model (WTF Do They Even Do?)
Magson runs on a retail + franchise model:
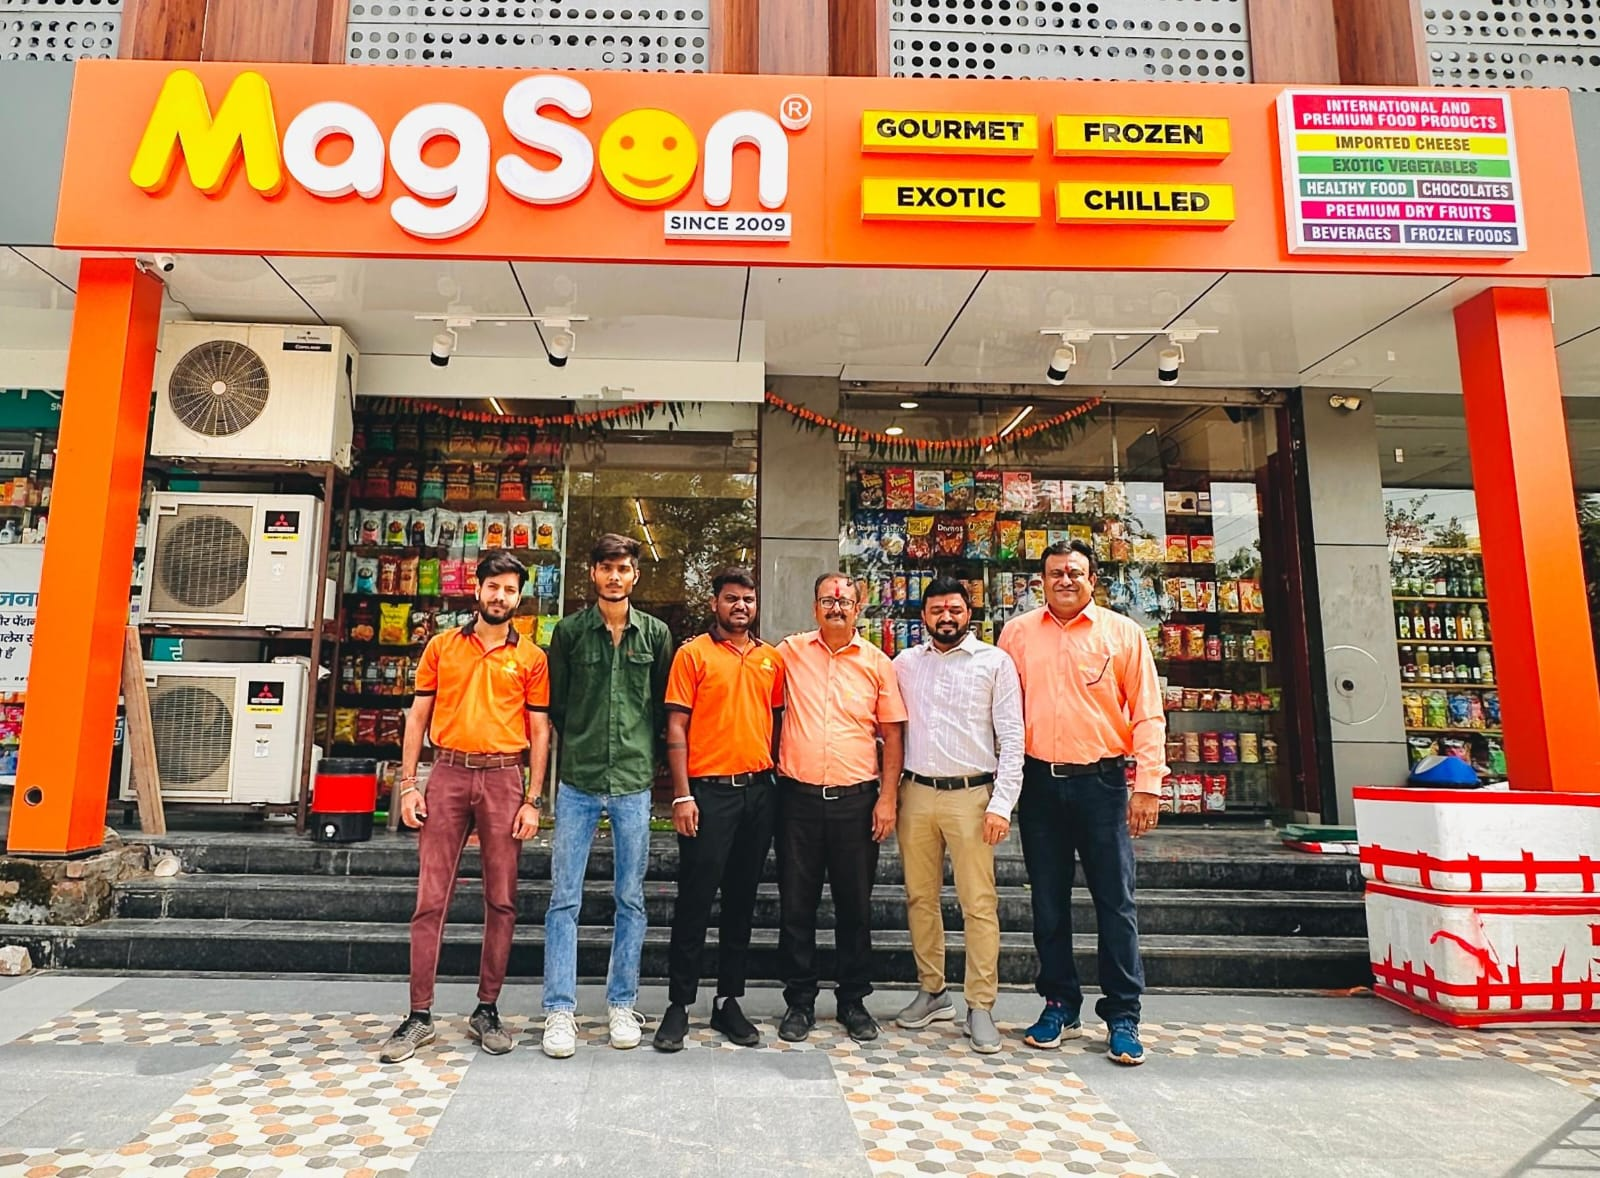
- Core Retail Stores: 41 outlets under MagSon brand (mostly in Gujarat, MP, Maharashtra, Rajasthan).
- Specialty Brands:
- My Chocolate World – niche chocolate stores.
- Nasta Bazar – local snacks (2 stores opened).
- Goan Bakery Pvt Ltd – JV for bakery & confectionery.
- Procurement: 75% direct from manufacturers (cutting out middlemen) → better margins.
- Warehousing: 14,000 sq. ft facility in Ahmedabad for centralised inventory control.
So far so good. But the economics of gourmet