1. At a Glance
Bajel Projects, the EPC arm spun out of Bajaj Electricals, has gone from negative operating margins in FY23 to a respectable 3% in FY25, while sales have exploded 4× in two years. The only problem? The stock trades at a 196x P/E, making it the equivalent of paying business class fares for a train journey.
2. Introduction
Bajel Projects Ltd (BPL) is like that cousin who left a family business to “do their own thing” – except here, the family is the ₹167+ billion Bajaj Group, and “their own thing” is executing big-ticket Power Transmission & Distribution EPC projects.
They’ve got the Bajaj name, an improving order book, and debt that’s still under control. The bad news? Interest costs are climbing faster than profits, and other income has been carrying more weight in the P&L than one might like to admit.
Still, the market’s pricing it like it’s already the next CG Power – spoiler: it’s not there yet.
3. Business Model (WTF Do They Even Do?)
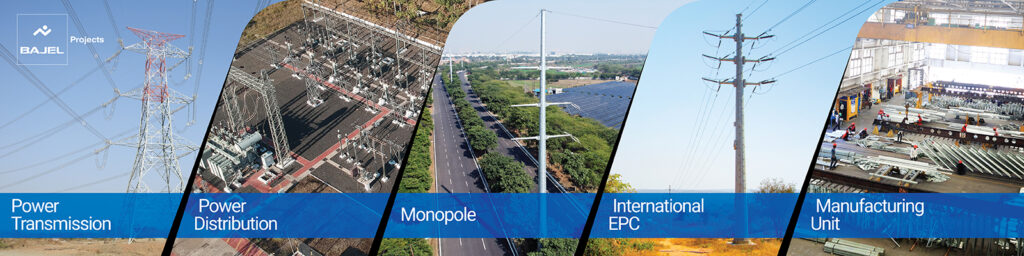
Bajel Projects is a full-service EPC provider in:
- Power Transmission – Laying high-voltage lines, substations, grid connectivity.
- Power Distribution – Urban/rural electrification, feeder separation, smart meters, the works.
Their USP: In-house design + manufacturing + installation + commissioning. That means they
can own the whole process, but it also means project execution delays hit them harder.
Clients? State utilities, government tenders, and private sector contracts – aka the crowd that’s known for lengthy payment cycles.
4. Financials Overview
TTM Revenue: ₹2,694 Cr
TTM Net Profit: ₹13 Cr
EBITDA: ₹69 Cr
EPS: ₹1.16
YoY Sales Growth: 82%
YoY PAT Growth: -24% (ouch)
Fresh P/E Calculation:
- Q1 FY26 EPS = ₹0.29
- Annualised = ₹1.16 (matches reported)
- CMP ₹224 ÷ ₹1.16 = P/E ≈ 193.1 (Screener shows 195.67 – rounding differences)
Verdict: Revenue’s growing like a weed, profit’s moving like a bonsai.
5. Valuation (Fair Value RANGE only)
| Method | Basis | Value (₹/share) |
|---|---|---|
| P/E | Sector avg 25× × EPS ₹1.16 | ₹29 |
| EV/EBITDA | Sector avg 12× × EBITDA ₹69 Cr | ₹135 |
| DCF | 12% WACC, 15% growth, 5-year horizon | ₹120–₹140 |
Fair Value Range: ₹29 – ₹140
This FV range is for educational purposes only and is not investment advice.
6. What’s Cooking
